.
.
Legal Acts
Documents
Electoral Bodies
Election Committees
Turnout
Results
Statistical Data
SENATE
PRESIDENT
Created by
.
.
Voting Results
.
.
.
Voting Results for Committee
.
.
.
.
.
.
.
.
.
.
.
.
.
.
.
.
.
.
.
.
Polska
/
Kielce
/
pińczowski, pow.
...
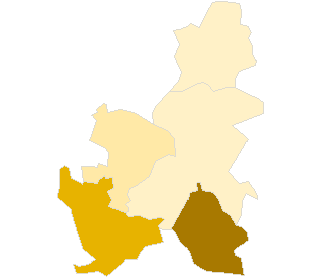
Komitet Wyborczy Polskiego Stronnictwa Ludowego
List's Number:
10
No. of valid votes:
11426
No. of votes per List:
2219
19.42%
lack
12.49%
15.63%
18.77%
21.91%
25.05%
28.19%
31.33%
34.47%
37.61%
40.75%
not
.
.
.
.
.
.
.
.
.
.
.
.
of data
15.62%
18.76%
21.90%
25.04%
28.18%
31.32%
34.46%
37.60%
40.74%
43.89%
applicable
See also:
Turnout
Votes per Lists
Votes per Candidates
Information about Election Committee
Election results
Voting Results by location of ward electoral commission
.
.
Voting Results for Committee.
.
.
.
.
.
.
.
.
.
.
.
.
.
.
.
.
.
No.
Name
No. of entitled
to vote
No. of ballot papers
issued
No. of votes
No. of votes: per list / valid [%]
total
valid
per List
260801
Działoszyce, gm.
4797
1422
1422
1364
481
35.26
260802
Kije, gm.
3679
1222
1222
1149
167
14.53
260803
Michałów, gm.
3991
1222
1220
1152
216
18.75
260804
Pińczów, gm.
18643
6799
6799
6532
816
12.49
260805
Złota, gm.
4057
1272
1272
1229
539
43.86
pińczowski, pow.
35167
11937
11935
11426
2219
19.42
.
.
Voting Results for Candidates
.
.
.
.
.
.
.
.
.
.
.
.
.
.
.
No.
Surname Names
No. of votes
% No. of votes per candidate/No. per list
% No. of votes per candidate/No. of valid votes
1
SZCZEPAŃCZYK Józef
90
4.05
0.79
2
PAWLAK Mirosław Antoni
405
18.25
3.54
3
BUGAJ Leszek Ryszard
18
0.81
0.16
4
KOWALCZYK Tadeusz Józef
263
11.85
2.30
5
PAŁYS Andrzej Józef
133
5.99
1.16
6
KOŁTUNOWICZ Wanda Genowefa
34
1.53
0.30
7
PIECYK Arkadiusz Andrzej
10
0.45
0.09
8
LEGAWIEC Wojciech
34
1.53
0.30
9
SAWA Mieczysław
5
0.22
0.04
10
PODRAZA Jan Józef
1005
45.29
8.80
11
LATO Andrzej Waldemar
27
1.21
0.24
12
MAZUR Stanisław
5
0.22
0.04
13
KOSIELA Jan Bogusław
7
0.31
0.06
14
MALASIŃSKA Janina
8
0.36
0.07
16
DUDA Rafał
6
0.27
0.05
17
BORZĘCKI Wojciech
6
0.27
0.05
18
DYL Czesław Maciej
0
0.00
0.00
19
WOŹNIAK Grażyna
11
0.49
0.10
20
ŻAK Ireneusz Stanisław
7
0.31
0.06
21
SĘK Andrzej Zbigniew
4
0.18
0.04
22
GIERADA Bogdan
10
0.45
0.09
23
KOLASA-ROGALA Zofia
9
0.40
0.08
24
NAPORA Henryk
3
0.13
0.03
25
WARELIS Adam
0
0.00
0.00
26
TYMIŃSKA-TKACZ Teresa
108
4.86
0.95
27
ŚLEDZIŃSKI Janusz Zbyszek
10
0.45
0.09
Σ
2218
99.95
19.41
.
.
Voting Results by location of ward electoral commission.
.
.
.
.
.
.
.
.
.
.
.
.
.
.
.
.
.
No.
Name
No. of entitled
to vote
No. of ballot
papers issued
No. of votes
No. of votes: per list / valid [%]
total
valid
per List
1
City
14059
5354
5354
5148
530
10.30
2
Country
21108
6583
6581
6278
1689
26.90
.
Voting Results by number of inhabitants of commune
.
1
to 5 000
3679
1222
1222
1149
167
14.53
2
from 5 001 to 10 000
12845
3916
3914
3745
1236
33.00
3
from 10 001 to 20 000
0
0
0
0
0
0.00
4
from 20 001 to 50 000
18643
6799
6799
6532
816
12.49
5
from 50 001 to 100 000
0
0
0
0
0
0.00
6
from 100 001 to 200 000
0
0
0
0
0
0.00
7
from 200 001 to 500 000
0
0
0
0
0
0.00
8
over 500 000
0
0
0
0
0
0.00
Legal Acts
Documents
Electoral Bodies
Election Committees
Turnout
Results
Statistical Data
SENATE
PRESIDENT
Created by
Copyright [c] 2005
Mikrobit Sp. z o.o.
. All Rights Reserved.
top