.
.
Legal Acts
Documents
Electoral Bodies
Election Committees
Turnout
Results
Statistical Data
SENATE
PRESIDENT
Created by
.
.
Voting Results
.
.
.
Voting Results for Committee
.
.
.
.
.
.
.
.
.
.
.
.
.
.
.
.
.
.
.
.
Polska
/
Kielce
/
kazimierski, pow.
...
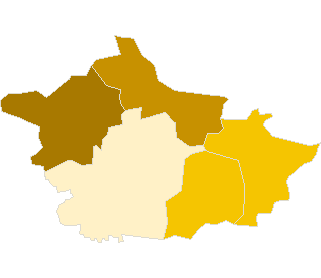
Komitet Wyborczy Polskiego Stronnictwa Ludowego
List's Number:
10
No. of valid votes:
8674
No. of votes per List:
2518
29.03%
lack
17.57%
20.13%
22.69%
25.25%
27.81%
30.37%
32.93%
35.49%
38.05%
40.61%
not
.
.
.
.
.
.
.
.
.
.
.
.
of data
20.12%
22.68%
25.24%
27.80%
30.36%
32.92%
35.48%
38.04%
40.60%
43.17%
applicable
See also:
Turnout
Votes per Lists
Votes per Candidates
Information about Election Committee
Election results
Voting Results by location of ward electoral commission
.
.
Voting Results for Committee.
.
.
.
.
.
.
.
.
.
.
.
.
.
.
.
.
.
No.
Name
No. of entitled
to vote
No. of ballot papers
issued
No. of votes
No. of votes: per list / valid [%]
total
valid
per List
260301
Bejsce, gm.
3619
831
831
809
280
34.61
260302
Czarnocin, gm.
3494
1144
1144
1087
439
40.39
260303
Kazimierza Wielka, gm.
14034
4241
4240
4096
720
17.58
260304
Opatowiec, gm.
3158
897
897
837
284
33.93
260305
Skalbmierz, gm.
5642
1927
1927
1845
795
43.09
kazimierski, pow.
29947
9040
9039
8674
2518
29.03
.
.
Voting Results for Candidates
.
.
.
.
.
.
.
.
.
.
.
.
.
.
.
No.
Surname Names
No. of votes
% No. of votes per candidate/No. per list
% No. of votes per candidate/No. of valid votes
1
SZCZEPAŃCZYK Józef
67
2.66
0.77
2
PAWLAK Mirosław Antoni
251
9.96
2.89
3
BUGAJ Leszek Ryszard
18
0.71
0.21
4
KOWALCZYK Tadeusz Józef
1641
65.17
18.92
5
PAŁYS Andrzej Józef
243
9.65
2.80
6
KOŁTUNOWICZ Wanda Genowefa
42
1.66
0.48
7
PIECYK Arkadiusz Andrzej
18
0.71
0.21
8
LEGAWIEC Wojciech
42
1.66
0.48
9
SAWA Mieczysław
3
0.11
0.03
10
PODRAZA Jan Józef
82
3.25
0.95
11
LATO Andrzej Waldemar
33
1.31
0.38
12
MAZUR Stanisław
9
0.35
0.10
13
KOSIELA Jan Bogusław
3
0.11
0.03
14
MALASIŃSKA Janina
1
0.03
0.01
16
DUDA Rafał
7
0.27
0.08
17
BORZĘCKI Wojciech
2
0.07
0.02
18
DYL Czesław Maciej
4
0.15
0.05
19
WOŹNIAK Grażyna
4
0.15
0.05
20
ŻAK Ireneusz Stanisław
3
0.11
0.03
21
SĘK Andrzej Zbigniew
4
0.15
0.05
22
GIERADA Bogdan
6
0.23
0.07
23
KOLASA-ROGALA Zofia
3
0.11
0.03
24
NAPORA Henryk
1
0.03
0.01
25
WARELIS Adam
0
0.00
0.00
26
TYMIŃSKA-TKACZ Teresa
22
0.87
0.25
27
ŚLEDZIŃSKI Janusz Zbyszek
2
0.07
0.02
Σ
2511
99.72
28.94
.
.
Voting Results by location of ward electoral commission.
.
.
.
.
.
.
.
.
.
.
.
.
.
.
.
.
.
No.
Name
No. of entitled
to vote
No. of ballot
papers issued
No. of votes
No. of votes: per list / valid [%]
total
valid
per List
1
City
8123
2964
2964
2855
516
18.07
2
Country
21824
6076
6075
5819
2002
34.40
.
Voting Results by number of inhabitants of commune
.
1
to 5 000
10271
2872
2872
2733
1003
36.70
2
from 5 001 to 10 000
5642
1927
1927
1845
795
43.09
3
from 10 001 to 20 000
14034
4241
4240
4096
720
17.58
4
from 20 001 to 50 000
0
0
0
0
0
0.00
5
from 50 001 to 100 000
0
0
0
0
0
0.00
6
from 100 001 to 200 000
0
0
0
0
0
0.00
7
from 200 001 to 500 000
0
0
0
0
0
0.00
8
over 500 000
0
0
0
0
0
0.00
Legal Acts
Documents
Electoral Bodies
Election Committees
Turnout
Results
Statistical Data
SENATE
PRESIDENT
Created by
Copyright [c] 2005
Mikrobit Sp. z o.o.
. All Rights Reserved.
top