.
.
Legal Acts
Documents
Electoral Bodies
Election Committees
Turnout
Results
Statistical Data
SENATE
PRESIDENT
Created by
.
.
Voting Results
.
.
.
Voting Results for Committee
.
.
.
.
.
.
.
.
.
.
.
.
.
.
.
.
.
.
.
.
Polska
/
Kielce
/
buski, pow.
...
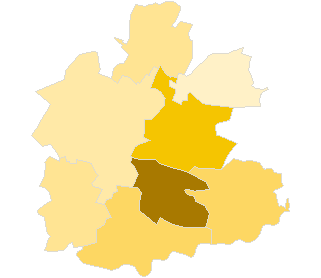
Komitet Wyborczy Polskiego Stronnictwa Ludowego
List's Number:
10
No. of valid votes:
21331
No. of votes per List:
5817
27.27%
lack
8.26%
14.34%
20.42%
26.50%
32.58%
38.66%
44.74%
50.82%
56.90%
62.98%
not
.
.
.
.
.
.
.
.
.
.
.
.
of data
14.33%
20.41%
26.49%
32.57%
38.65%
44.73%
50.81%
56.89%
62.97%
69.06%
applicable
See also:
Turnout
Votes per Lists
Votes per Candidates
Information about Election Committee
Election results
Voting Results by location of ward electoral commission
.
.
Voting Results for Committee.
.
.
.
.
.
.
.
.
.
.
.
.
.
.
.
.
.
No.
Name
No. of entitled
to vote
No. of ballot papers
issued
No. of votes
No. of votes: per list / valid [%]
total
valid
per List
260101
Busko-Zdrój, gm.
27624
10165
10158
9805
1500
15.30
260102
Gnojno, gm.
3809
1222
1222
1178
281
23.85
260103
Nowy Korczyn, gm.
5354
1886
1886
1818
622
34.21
260104
Pacanów, gm.
6589
2004
2003
1934
655
33.87
260105
Solec-Zdrój, gm.
4105
1885
1885
1828
1262
69.04
260106
Stopnica, gm.
6565
2251
2246
2154
1040
48.28
260107
Tuczępy, gm.
3050
1320
1320
1258
104
8.27
260108
Wiślica, gm.
4840
1420
1413
1356
353
26.03
buski, pow.
61936
22153
22133
21331
5817
27.27
.
.
Voting Results for Candidates
.
.
.
.
.
.
.
.
.
.
.
.
.
.
.
No.
Surname Names
No. of votes
% No. of votes per candidate/No. per list
% No. of votes per candidate/No. of valid votes
1
SZCZEPAŃCZYK Józef
131
2.25
0.61
2
PAWLAK Mirosław Antoni
347
5.96
1.63
3
BUGAJ Leszek Ryszard
47
0.80
0.22
4
KOWALCZYK Tadeusz Józef
25
0.42
0.12
5
PAŁYS Andrzej Józef
3398
58.41
15.93
6
KOŁTUNOWICZ Wanda Genowefa
19
0.32
0.09
7
PIECYK Arkadiusz Andrzej
100
1.71
0.47
8
LEGAWIEC Wojciech
969
16.65
4.54
9
SAWA Mieczysław
3
0.05
0.01
10
PODRAZA Jan Józef
234
4.02
1.10
11
LATO Andrzej Waldemar
82
1.40
0.38
12
MAZUR Stanisław
302
5.19
1.42
13
KOSIELA Jan Bogusław
3
0.05
0.01
14
MALASIŃSKA Janina
6
0.10
0.03
16
DUDA Rafał
5
0.08
0.02
17
BORZĘCKI Wojciech
7
0.12
0.03
18
DYL Czesław Maciej
5
0.08
0.02
19
WOŹNIAK Grażyna
12
0.20
0.06
20
ŻAK Ireneusz Stanisław
6
0.10
0.03
21
SĘK Andrzej Zbigniew
1
0.01
0.00
22
GIERADA Bogdan
8
0.13
0.04
23
KOLASA-ROGALA Zofia
0
0.00
0.00
24
NAPORA Henryk
1
0.01
0.00
25
WARELIS Adam
0
0.00
0.00
26
TYMIŃSKA-TKACZ Teresa
92
1.58
0.43
27
ŚLEDZIŃSKI Janusz Zbyszek
11
0.18
0.05
Σ
5814
99.94
27.25
.
.
Voting Results by location of ward electoral commission.
.
.
.
.
.
.
.
.
.
.
.
.
.
.
.
.
.
No.
Name
No. of entitled
to vote
No. of ballot
papers issued
No. of votes
No. of votes: per list / valid [%]
total
valid
per List
1
City
15258
6405
6398
6185
610
9.86
2
Country
46678
15748
15735
15146
5207
34.38
.
Voting Results by number of inhabitants of commune
.
1
to 5 000
6859
2542
2542
2436
385
15.80
2
from 5 001 to 10 000
27453
9446
9433
9090
3932
43.26
3
from 10 001 to 20 000
0
0
0
0
0
0.00
4
from 20 001 to 50 000
27624
10165
10158
9805
1500
15.30
5
from 50 001 to 100 000
0
0
0
0
0
0.00
6
from 100 001 to 200 000
0
0
0
0
0
0.00
7
from 200 001 to 500 000
0
0
0
0
0
0.00
8
over 500 000
0
0
0
0
0
0.00
Legal Acts
Documents
Electoral Bodies
Election Committees
Turnout
Results
Statistical Data
SENATE
PRESIDENT
Created by
Copyright [c] 2005
Mikrobit Sp. z o.o.
. All Rights Reserved.
top