.
.
Legal Acts
Documents
Electoral Bodies
Election Committees
Turnout
Results
Statistical Data
SENATE
PRESIDENT
Created by
.
.
Voting Results
.
.
.
Voting Results for Committee
.
.
.
.
.
.
.
.
.
.
.
.
.
.
.
.
.
.
.
.
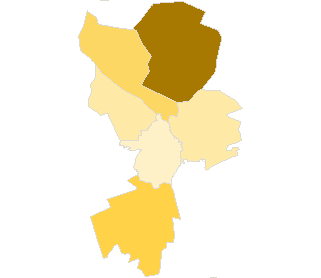
Polska
/
Rzeszów
/
stalowowolski, pow.
...
Komitet Wyborczy Polskiego Stronnictwa Ludowego
List's Number:
10
No. of valid votes:
34008
No. of votes per List:
1225
3.60%
lack
1.88%
3.08%
4.28%
5.48%
6.68%
7.88%
9.08%
10.28%
11.48%
12.68%
not
.
.
.
.
.
.
.
.
.
.
.
.
of data
3.07%
4.27%
5.47%
6.67%
7.87%
9.07%
10.27%
11.47%
12.67%
13.88%
applicable
See also:
Turnout
Votes per Lists
Votes per Candidates
Information about Election Committee
Election results
Voting Results by location of ward electoral commission
.
.
Voting Results for Committee.
.
.
.
.
.
.
.
.
.
.
.
.
.
.
.
.
.
No.
Name
No. of entitled
to vote
No. of ballot papers
issued
No. of votes
No. of votes: per list / valid [%]
total
valid
per List
181802
Bojanów, gm.
5264
1870
1863
1768
151
8.54
181803
Pysznica, gm.
7160
2921
2920
2806
92
3.28
181804
Radomyśl nad Sanem, gm.
5794
2013
2012
1925
132
6.86
181801
Stalowa Wola, m.
54836
22903
22888
22284
420
1.88
181805
Zaklików, gm.
6717
2269
2269
2171
300
13.82
181806
Zaleszany, gm.
8215
3198
3186
3054
130
4.26
stalowowolski, pow.
87986
35174
35138
34008
1225
3.60
.
.
Voting Results for Candidates
.
.
.
.
.
.
.
.
.
.
.
.
.
.
.
No.
Surname Names
No. of votes
% No. of votes per candidate/No. per list
% No. of votes per candidate/No. of valid votes
1
BURY Jan
195
15.91
0.57
2
BUJAK Bolesław
74
6.04
0.22
3
KORDAS Jerzy Jan
10
0.81
0.03
4
KOŚCIELNY Stanisław
33
2.69
0.10
5
NAWROCKI Janusz Andrzej
70
5.71
0.21
6
CHRABĄSZCZ Andrzej
8
0.65
0.02
7
REGUŁA Andrzej Zygmunt
9
0.73
0.03
8
ŚLIWIŃSKI Marek
13
1.06
0.04
9
HALESIAK Tadeusz
11
0.89
0.03
10
KĄTNIK-KOWALSKA Magdalena
14
1.14
0.04
11
TABOR Stanisław
23
1.87
0.07
12
SOŁTYS Mariusz
333
27.18
0.98
13
ŚWIETLIK Barbara Anna
6
0.48
0.02
14
BARAN Stefan
7
0.57
0.02
15
SURMACZ Edward
144
11.75
0.42
16
LESICZKA Gabriel
137
11.18
0.40
17
SZCZĘCH Władysław
6
0.48
0.02
18
LIPSKI Maciej
3
0.24
0.01
19
SERAFIN Danuta
13
1.06
0.04
20
ŻARÓW Stefan Michał
4
0.32
0.01
21
CHMURA Edward Jan
73
5.95
0.21
22
MUSIAŁ Feliks Jan
4
0.32
0.01
23
SZEWCZYK Mariusz Krzysztof
3
0.24
0.01
24
GIERLACH Jacek Adam
4
0.32
0.01
25
TOKARZ Małgorzata
5
0.40
0.01
26
WILGA Józef
3
0.24
0.01
27
CHARA Janusz Tadeusz
6
0.48
0.02
28
DERNOGA Agnieszka Ewa
3
0.24
0.01
29
MAMCZARZ Krzysztof Jan
2
0.16
0.01
30
KOCZUR Dorota Krystyna
9
0.73
0.03
Σ
1225
100.00
3.60
.
.
Voting Results by location of ward electoral commission.
.
.
.
.
.
.
.
.
.
.
.
.
.
.
.
.
.
No.
Name
No. of entitled
to vote
No. of ballot
papers issued
No. of votes
No. of votes: per list / valid [%]
total
valid
per List
1
City
54836
22903
22888
22284
420
1.88
2
Country
33150
12271
12250
11724
805
6.87
.
Voting Results by number of inhabitants of commune
.
1
to 5 000
0
0
0
0
0
0.00
2
from 5 001 to 10 000
24935
9073
9064
8670
675
7.79
3
from 10 001 to 20 000
8215
3198
3186
3054
130
4.26
4
from 20 001 to 50 000
0
0
0
0
0
0.00
5
from 50 001 to 100 000
54836
22903
22888
22284
420
1.88
6
from 100 001 to 200 000
0
0
0
0
0
0.00
7
from 200 001 to 500 000
0
0
0
0
0
0.00
8
over 500 000
0
0
0
0
0
0.00
Legal Acts
Documents
Electoral Bodies
Election Committees
Turnout
Results
Statistical Data
SENATE
PRESIDENT
Created by
Copyright [c] 2005
Mikrobit Sp. z o.o.
. All Rights Reserved.
top