.
.
Legal Acts
Documents
Electoral Bodies
Election Committees
Turnout
Results
Statistical Data
SENATE
PRESIDENT
Created by
.
.
Voting Results
.
.
.
Voting Results for Committee
.
.
.
.
.
.
.
.
.
.
.
.
.
.
.
.
.
.
.
.
Polska
/
Rzeszów
/
łańcucki, pow.
...
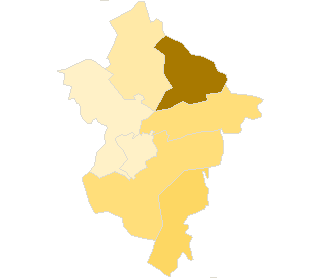
Komitet Wyborczy Polskiego Stronnictwa Ludowego
List's Number:
10
No. of valid votes:
27149
No. of votes per List:
2356
8.68%
lack
2.35%
4.95%
7.55%
10.15%
12.75%
15.35%
17.95%
20.55%
23.15%
25.75%
not
.
.
.
.
.
.
.
.
.
.
.
.
of data
4.94%
7.54%
10.14%
12.74%
15.34%
17.94%
20.54%
23.14%
25.74%
28.35%
applicable
See also:
Turnout
Votes per Lists
Votes per Candidates
Information about Election Committee
Election results
Voting Results by location of ward electoral commission
.
.
Voting Results for Committee.
.
.
.
.
.
.
.
.
.
.
.
.
.
.
.
.
.
No.
Name
No. of entitled
to vote
No. of ballot papers
issued
No. of votes
No. of votes: per list / valid [%]
total
valid
per List
181002
Białobrzegi, gm.
6020
2444
2444
2361
297
12.58
181003
Czarna, gm.
8054
4216
4215
4119
97
2.35
181004
Łańcut, gm.
15423
7096
7086
6881
705
10.25
181001
Łańcut, m.
14381
7124
7122
6969
197
2.83
181005
Markowa, gm.
4954
1885
1885
1810
250
13.81
181006
Rakszawa, gm.
5368
2849
2849
2770
176
6.35
181007
Żołynia, gm.
5158
2324
2324
2239
634
28.32
łańcucki, pow.
59358
27938
27925
27149
2356
8.68
.
.
Voting Results for Candidates
.
.
.
.
.
.
.
.
.
.
.
.
.
.
.
No.
Surname Names
No. of votes
% No. of votes per candidate/No. per list
% No. of votes per candidate/No. of valid votes
1
BURY Jan
1456
61.79
5.36
2
BUJAK Bolesław
26
1.10
0.10
3
KORDAS Jerzy Jan
63
2.67
0.23
4
KOŚCIELNY Stanisław
11
0.46
0.04
5
NAWROCKI Janusz Andrzej
8
0.33
0.03
6
CHRABĄSZCZ Andrzej
26
1.10
0.10
7
REGUŁA Andrzej Zygmunt
6
0.25
0.02
8
ŚLIWIŃSKI Marek
5
0.21
0.02
9
HALESIAK Tadeusz
11
0.46
0.04
10
KĄTNIK-KOWALSKA Magdalena
547
23.21
2.01
11
TABOR Stanisław
4
0.16
0.01
12
SOŁTYS Mariusz
5
0.21
0.02
13
ŚWIETLIK Barbara Anna
20
0.84
0.07
14
BARAN Stefan
7
0.29
0.03
15
SURMACZ Edward
16
0.67
0.06
16
LESICZKA Gabriel
8
0.33
0.03
17
SZCZĘCH Władysław
3
0.12
0.01
18
LIPSKI Maciej
9
0.38
0.03
19
SERAFIN Danuta
8
0.33
0.03
20
ŻARÓW Stefan Michał
3
0.12
0.01
21
CHMURA Edward Jan
1
0.04
0.00
22
MUSIAŁ Feliks Jan
2
0.08
0.01
23
SZEWCZYK Mariusz Krzysztof
1
0.04
0.00
24
GIERLACH Jacek Adam
3
0.12
0.01
25
TOKARZ Małgorzata
8
0.33
0.03
26
WILGA Józef
0
0.00
0.00
27
CHARA Janusz Tadeusz
0
0.00
0.00
28
DERNOGA Agnieszka Ewa
1
0.04
0.00
29
MAMCZARZ Krzysztof Jan
93
3.94
0.34
30
KOCZUR Dorota Krystyna
5
0.21
0.02
Σ
2356
100.00
8.67
.
.
Voting Results by location of ward electoral commission.
.
.
.
.
.
.
.
.
.
.
.
.
.
.
.
.
.
No.
Name
No. of entitled
to vote
No. of ballot
papers issued
No. of votes
No. of votes: per list / valid [%]
total
valid
per List
1
City
14381
7124
7122
6969
197
2.83
2
Country
44977
20814
20803
20180
2159
10.70
.
Voting Results by number of inhabitants of commune
.
1
to 5 000
0
0
0
0
0
0.00
2
from 5 001 to 10 000
21500
9502
9502
9180
1357
14.78
3
from 10 001 to 20 000
22435
11340
11337
11088
294
2.65
4
from 20 001 to 50 000
15423
7096
7086
6881
705
10.25
5
from 50 001 to 100 000
0
0
0
0
0
0.00
6
from 100 001 to 200 000
0
0
0
0
0
0.00
7
from 200 001 to 500 000
0
0
0
0
0
0.00
8
over 500 000
0
0
0
0
0
0.00
Legal Acts
Documents
Electoral Bodies
Election Committees
Turnout
Results
Statistical Data
SENATE
PRESIDENT
Created by
Copyright [c] 2005
Mikrobit Sp. z o.o.
. All Rights Reserved.
top