.
.
Legal Acts
Documents
Electoral Bodies
Election Committees
Turnout
Results
Statistical Data
SENATE
PRESIDENT
Created by
.
.
Voting Results
.
.
.
Voting Results for Committee
.
.
.
.
.
.
.
.
.
.
.
.
.
.
.
.
.
.
.
.
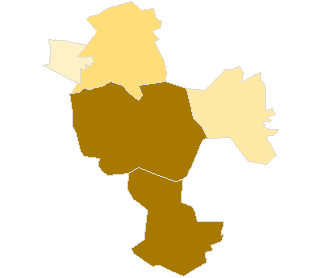
Polska
/
Lublin
/
świdnicki, pow.
...
Komitet Wyborczy Polskiego Stronnictwa Ludowego
List's Number:
10
No. of valid votes:
22024
No. of votes per List:
1926
8.75%
lack
2.96%
5.55%
8.14%
10.73%
13.32%
15.91%
18.50%
21.09%
23.68%
26.27%
not
.
.
.
.
.
.
.
.
.
.
.
.
of data
5.54%
8.13%
10.72%
13.31%
15.90%
18.49%
21.08%
23.67%
26.26%
28.86%
applicable
See also:
Turnout
Votes per Lists
Votes per Candidates
Information about Election Committee
Election results
Voting Results by location of ward electoral commission
.
.
Voting Results for Committee.
.
.
.
.
.
.
.
.
.
.
.
.
.
.
.
.
.
No.
Name
No. of entitled
to vote
No. of ballot papers
issued
No. of votes
No. of votes: per list / valid [%]
total
valid
per List
061702
Mełgiew, gm.
6186
2251
2251
2179
274
12.57
061703
Piaski, gm.
8513
2769
2768
2684
759
28.28
061704
Rybczewice, gm.
3281
1247
1247
1162
335
28.83
061701
Świdnik, m.
33209
14431
14415
14053
416
2.96
061705
Trawniki, gm.
7264
2074
2074
1946
142
7.30
świdnicki, pow.
58453
22772
22755
22024
1926
8.75
.
.
Voting Results for Candidates
.
.
.
.
.
.
.
.
.
.
.
.
.
.
.
No.
Surname Names
No. of votes
% No. of votes per candidate/No. per list
% No. of votes per candidate/No. of valid votes
1
ŁOPATA Jan
269
13.96
1.22
2
STAROWNIK Marian Roman
102
5.29
0.46
3
ŚWIĘTOCHOWSKI Leszek Jan
16
0.83
0.07
4
MICHALIK Marek Stanisław
24
1.24
0.11
5
OLSZAK-WINIARSKA Maria
47
2.44
0.21
6
RODZIK Zenon Jerzy
10
0.51
0.05
7
CIOŁEK Włodzimierz
338
17.54
1.53
8
ĆWIERZ Kazimierz
10
0.51
0.05
9
GOMÓŁKA Włodzimierz Marian
8
0.41
0.04
10
GRUDZIEŃ Wiesław Zygmunt
23
1.19
0.10
11
JAGIEŁŁO Stanisław
18
0.93
0.08
12
JĄCZYK Agata Maria
507
26.32
2.30
13
KASIAK Czesław Grzegorz
50
2.59
0.23
14
KASPEREK Tadeusz
9
0.46
0.04
15
KRACZKOWSKI Leszek
3
0.15
0.01
16
MACHNIAK Bernarda Ewa
7
0.36
0.03
17
MAJ Andrzej
10
0.51
0.05
18
MALINOWSKI Janusz
8
0.41
0.04
19
MOJZYCH Andrzej Marek
3
0.15
0.01
20
MÜLLER Maria Jolanta
1
0.05
0.00
21
OBROŚLAK Józef
4
0.20
0.02
22
PODGÓRSKI Jerzy Waldemar
20
1.03
0.09
23
PODKAŃSKI Krzysztof Piotr
196
10.17
0.89
24
RELIGA Grzegorz
13
0.67
0.06
25
SKOREK Grzegorz
7
0.36
0.03
26
SMOLARZ Henryk Józef
105
5.45
0.48
27
SOLARSKI Tadeusz
83
4.30
0.38
28
STASIAK Witold Adam
6
0.31
0.03
29
WISOWSKA Katarzyna
10
0.51
0.05
30
ŻABA Marian
19
0.98
0.09
Σ
1926
100.00
8.74
.
.
Voting Results by location of ward electoral commission.
.
.
.
.
.
.
.
.
.
.
.
.
.
.
.
.
.
No.
Name
No. of entitled
to vote
No. of ballot
papers issued
No. of votes
No. of votes: per list / valid [%]
total
valid
per List
1
City
35349
15279
15263
14867
556
3.74
2
Country
23104
7493
7492
7157
1370
19.14
.
Voting Results by number of inhabitants of commune
.
1
to 5 000
3281
1247
1247
1162
335
28.83
2
from 5 001 to 10 000
13450
4325
4325
4125
416
10.08
3
from 10 001 to 20 000
8513
2769
2768
2684
759
28.28
4
from 20 001 to 50 000
33209
14431
14415
14053
416
2.96
5
from 50 001 to 100 000
0
0
0
0
0
0.00
6
from 100 001 to 200 000
0
0
0
0
0
0.00
7
from 200 001 to 500 000
0
0
0
0
0
0.00
8
over 500 000
0
0
0
0
0
0.00
Legal Acts
Documents
Electoral Bodies
Election Committees
Turnout
Results
Statistical Data
SENATE
PRESIDENT
Created by
Copyright [c] 2005
Mikrobit Sp. z o.o.
. All Rights Reserved.
top