| . |
. |
Voting Results for Committee |
. |
. |
| . |
. |
| . |
. |
. |
. |
. |
. |
. |
. |
. |
. |
. |
. |
. |
. |
. |
. |
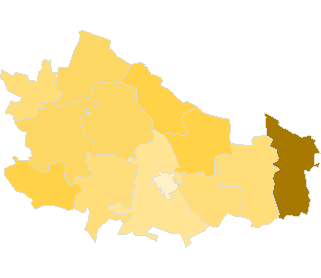
| Polska / Lublin / lubartowski, pow. ... |
 |
| Komitet Wyborczy Polskiego Stronnictwa Ludowego |
| List's Number: |
10 |
| No. of valid votes: |
26822 |
| No. of votes per List: |
4965 |
18.51% |
|
| lack | 9.16% | 12.26% | 15.36% | 18.46% | 21.56% | 24.66% | 27.76% | 30.86% | 33.96% | 37.06% | not | | . | . | . | . | . | . | . | . | . | . | . | . | | of data | 12.25% | 15.35% | 18.45% | 21.55% | 24.65% | 27.75% | 30.85% | 33.95% | 37.05% | 40.16% | applicable |
|
See also:
|
| . |
. |
Voting Results for Committee. |
. |
. |
| . |
. |
| . |
. |
. |
. |
. |
. |
. |
. |
. |
. |
. |
. |
. |
| No. |
Name |
No. of entitled
to vote |
No. of ballot papers
issued |
No. of votes |
No. of votes: per list / valid [%] |
| total |
valid |
per List |
| 060802 | Abramów, gm. | 3479 | 1447 | 1446 | 1390 | 362 | 26.04 |  |
| 060803 | Firlej, gm. | 4824 | 1506 | 1505 | 1423 | 320 | 22.49 | |
| 060804 | Jeziorzany, gm. | 2508 | 845 | 845 | 797 | 157 | 19.70 | |
| 060805 | Kamionka, gm. | 5024 | 1910 | 1910 | 1802 | 344 | 19.09 | |
| 060806 | Kock, gm. | 5434 | 1932 | 1931 | 1768 | 403 | 22.79 | |
| 060807 | Lubartów, gm. | 7680 | 2715 | 2714 | 2585 | 421 | 16.29 | |
| 060801 | Lubartów, m. | 18705 | 8206 | 8188 | 7913 | 725 | 9.16 | |
| 060808 | Michów, gm. | 5223 | 2116 | 2116 | 2035 | 455 | 22.36 | |
| 060809 | Niedźwiada, gm. | 4976 | 1907 | 1907 | 1799 | 448 | 24.90 | |
| 060810 | Ostrów Lubelski, gm. | 4419 | 1792 | 1790 | 1692 | 354 | 20.92 | |
| 060811 | Ostrówek, gm. | 3350 | 1257 | 1257 | 1177 | 293 | 24.89 | |
| 060812 | Serniki, gm. | 3754 | 1532 | 1531 | 1463 | 291 | 19.89 | |
| 060813 | Uścimów, gm. | 2742 | 1033 | 1033 | 978 | 392 | 40.08 | |
| |
lubartowski, pow. |
72118 |
28198 |
28173 |
26822 |
4965 |
18.51 |
 |
|
| |
| . |
. |
Voting Results by location of ward electoral commission. |
. |
. |
| . |
. |
| . |
. |
. |
. |
. |
. |
. |
. |
. |
. |
. |
. |
. |
| No. |
Name |
No. of entitled
to vote |
No. of ballot
papers issued |
No. of votes |
No. of votes: per list / valid [%] |
| total |
valid |
per List |
| 1 | City | 23470 | 10197 | 10177 | 9765 | 1146 | 11.74 | |
| 2 | Country | 48648 | 18001 | 17996 | 17057 | 3819 | 22.39 | |
| . |
Voting Results by number of inhabitants of commune |
. |
| 1 | to 5 000 | 15833 | 6114 | 6112 | 5805 | 1495 | 25.75 | |
| 2 | from 5 001 to 10 000 | 29900 | 11163 | 11159 | 10519 | 2324 | 22.09 | |
| 3 | from 10 001 to 20 000 | 7680 | 2715 | 2714 | 2585 | 421 | 16.29 | |
| 4 | from 20 001 to 50 000 | 18705 | 8206 | 8188 | 7913 | 725 | 9.16 | |
| 5 | from 50 001 to 100 000 | 0 | 0 | 0 | 0 | 0 | 0.00 | |
| 6 | from 100 001 to 200 000 | 0 | 0 | 0 | 0 | 0 | 0.00 | |
| 7 | from 200 001 to 500 000 | 0 | 0 | 0 | 0 | 0 | 0.00 | |
| 8 | over 500 000 | 0 | 0 | 0 | 0 | 0 | 0.00 | |
|
|


 Legal Acts
 Legal Acts