.
.
Legal Acts
Documents
Electoral Bodies
Election Committees
Turnout
Results
Statistical Data
SENATE
PRESIDENT
Created by
.
.
Voting Results
.
.
.
Voting Results for Committee
.
.
.
.
.
.
.
.
.
.
.
.
.
.
.
.
.
.
.
.
Polska
/
Bydgoszcz
/
nakielski, pow.
...
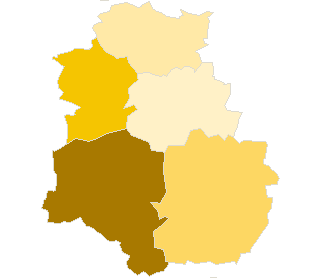
Komitet Wyborczy Polskiego Stronnictwa Ludowego
List's Number:
10
No. of valid votes:
21128
No. of votes per List:
1896
8.97%
lack
3.94%
5.44%
6.94%
8.44%
9.94%
11.44%
12.94%
14.44%
15.94%
17.44%
not
.
.
.
.
.
.
.
.
.
.
.
.
of data
5.43%
6.93%
8.43%
9.93%
11.43%
12.93%
14.43%
15.93%
17.43%
18.94%
applicable
See also:
Turnout
Votes per Lists
Votes per Candidates
Information about Election Committee
Election results
Voting Results by location of ward electoral commission
.
.
Voting Results for Committee.
.
.
.
.
.
.
.
.
.
.
.
.
.
.
.
.
.
No.
Name
No. of entitled
to vote
No. of ballot papers
issued
No. of votes
No. of votes: per list / valid [%]
total
valid
per List
041001
Kcynia, gm.
10551
3437
3435
3088
583
18.88
041002
Mrocza, gm.
6828
2250
2250
2079
140
6.73
041003
Nakło nad Notecią, gm.
26379
9385
9375
8755
345
3.94
041004
Sadki, gm.
5392
1963
1947
1769
237
13.40
041005
Szubin, gm.
17270
5858
5821
5437
591
10.87
nakielski, pow.
66420
22893
22828
21128
1896
8.97
.
.
Voting Results for Candidates
.
.
.
.
.
.
.
.
.
.
.
.
.
.
.
No.
Surname Names
No. of votes
% No. of votes per candidate/No. per list
% No. of votes per candidate/No. of valid votes
1
KŁOPOTEK Eugeniusz
653
34.44
3.09
2
KOZŁOWSKA Zofia Władysława
94
4.95
0.44
3
BĄKOWSKI Zenon Stanisław
31
1.63
0.15
4
BARCZAK Tomasz
14
0.73
0.07
5
SZCZEPANIAK Tomasz Antoni
493
26.00
2.33
6
CHMIELEWSKI Grzegorz Kazimierz
7
0.36
0.03
7
MES Ewa Monika
8
0.42
0.04
8
ZABOROWSKI Tadeusz
15
0.79
0.07
9
DOMEK Henryk Stanisław
12
0.63
0.06
10
ŚLĘZAK Tomasz Izydor
5
0.26
0.02
11
SABACIŃSKI Zbigniew
325
17.14
1.54
12
KIERSZNICKI Zygmunt Franciszek
8
0.42
0.04
13
JAGODZIŃSKI Ryszard Paweł
23
1.21
0.11
14
WASIELEWICZ Piotr Stanisław
1
0.05
0.00
15
KURZAWA Dariusz
10
0.52
0.05
16
KOMINIAK Jan Wojciech
136
7.17
0.64
17
ORLIŃSKI Wojciech
7
0.36
0.03
18
GRZECA Zdzisław Jan
3
0.15
0.01
19
TROJANOWSKI Tomasz Michał
1
0.05
0.00
20
GADACZ Edyta
11
0.58
0.05
21
GROCHAL Andrzej Józef
4
0.21
0.02
22
SZULC Piotr Mirosław
5
0.26
0.02
23
MAJEWSKI Tadeusz Jan
5
0.26
0.02
24
SZYMAŃSKA Anna-Maria
25
1.31
0.12
Σ
1896
100.00
8.97
.
.
Voting Results by location of ward electoral commission.
.
.
.
.
.
.
.
.
.
.
.
.
.
.
.
.
.
No.
Name
No. of entitled
to vote
No. of ballot
papers issued
No. of votes
No. of votes: per list / valid [%]
total
valid
per List
1
City
30953
11589
11543
10742
599
5.58
2
Country
35467
11304
11285
10386
1297
12.49
.
Voting Results by number of inhabitants of commune
.
1
to 5 000
0
0
0
0
0
0.00
2
from 5 001 to 10 000
12220
4213
4197
3848
377
9.80
3
from 10 001 to 20 000
10551
3437
3435
3088
583
18.88
4
from 20 001 to 50 000
43649
15243
15196
14192
936
6.60
5
from 50 001 to 100 000
0
0
0
0
0
0.00
6
from 100 001 to 200 000
0
0
0
0
0
0.00
7
from 200 001 to 500 000
0
0
0
0
0
0.00
8
over 500 000
0
0
0
0
0
0.00
Legal Acts
Documents
Electoral Bodies
Election Committees
Turnout
Results
Statistical Data
SENATE
PRESIDENT
Created by
Copyright [c] 2005
Mikrobit Sp. z o.o.
. All Rights Reserved.
top