.
.
Legal Acts
Documents
Electoral Bodies
Election Committees
Turnout
Results
Statistical Data
SENATE
PRESIDENT
Created by
.
.
Voting Results
.
.
.
Voting Results for Committee
.
.
.
.
.
.
.
.
.
.
.
.
.
.
.
.
.
.
.
.
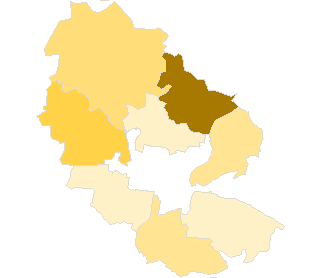
Polska
/
Bydgoszcz
/
bydgoski, pow.
...
Komitet Wyborczy Polskiego Stronnictwa Ludowego
List's Number:
10
No. of valid votes:
22589
No. of votes per List:
1275
5.64%
lack
2.00%
3.30%
4.60%
5.90%
7.20%
8.50%
9.80%
11.10%
12.40%
13.70%
not
.
.
.
.
.
.
.
.
.
.
.
.
of data
3.29%
4.59%
5.89%
7.19%
8.49%
9.79%
11.09%
12.39%
13.69%
15.00%
applicable
See also:
Turnout
Votes per Lists
Votes per Candidates
Information about Election Committee
Election results
Voting Results by location of ward electoral commission
.
.
Voting Results for Committee.
.
.
.
.
.
.
.
.
.
.
.
.
.
.
.
.
.
No.
Name
No. of entitled
to vote
No. of ballot papers
issued
No. of votes
No. of votes: per list / valid [%]
total
valid
per List
040301
Białe Błota, gm.
9765
3723
3723
3494
70
2.00
040302
Dąbrowa Chełmińska, gm.
5272
1578
1575
1453
84
5.78
040303
Dobrcz, gm.
6941
2304
2302
2095
314
14.99
040304
Koronowo, gm.
18166
5648
5631
5258
345
6.56
040305
Nowa Wieś Wielka, gm.
5939
1772
1769
1633
82
5.02
040306
Osielsko, gm.
6094
2661
2658
2504
82
3.27
040307
Sicienko, gm.
6805
2334
2334
2132
206
9.66
040308
Solec Kujawski, gm.
12333
4373
4364
4020
92
2.29
bydgoski, pow.
71315
24393
24356
22589
1275
5.64
.
.
Voting Results for Candidates
.
.
.
.
.
.
.
.
.
.
.
.
.
.
.
No.
Surname Names
No. of votes
% No. of votes per candidate/No. per list
% No. of votes per candidate/No. of valid votes
1
KŁOPOTEK Eugeniusz
578
45.33
2.56
2
KOZŁOWSKA Zofia Władysława
62
4.86
0.27
3
BĄKOWSKI Zenon Stanisław
23
1.80
0.10
4
BARCZAK Tomasz
25
1.96
0.11
5
SZCZEPANIAK Tomasz Antoni
12
0.94
0.05
6
CHMIELEWSKI Grzegorz Kazimierz
11
0.86
0.05
7
MES Ewa Monika
258
20.23
1.14
8
ZABOROWSKI Tadeusz
10
0.78
0.04
9
DOMEK Henryk Stanisław
24
1.88
0.11
10
ŚLĘZAK Tomasz Izydor
5
0.39
0.02
11
SABACIŃSKI Zbigniew
0
0.00
0.00
12
KIERSZNICKI Zygmunt Franciszek
3
0.23
0.01
13
JAGODZIŃSKI Ryszard Paweł
16
1.25
0.07
14
WASIELEWICZ Piotr Stanisław
8
0.62
0.04
15
KURZAWA Dariusz
4
0.31
0.02
16
KOMINIAK Jan Wojciech
8
0.62
0.04
17
ORLIŃSKI Wojciech
123
9.64
0.54
18
GRZECA Zdzisław Jan
6
0.47
0.03
19
TROJANOWSKI Tomasz Michał
1
0.07
0.00
20
GADACZ Edyta
12
0.94
0.05
21
GROCHAL Andrzej Józef
27
2.11
0.12
22
SZULC Piotr Mirosław
6
0.47
0.03
23
MAJEWSKI Tadeusz Jan
10
0.78
0.04
24
SZYMAŃSKA Anna-Maria
43
3.37
0.19
Σ
1275
100.00
5.64
.
.
Voting Results by location of ward electoral commission.
.
.
.
.
.
.
.
.
.
.
.
.
.
.
.
.
.
No.
Name
No. of entitled
to vote
No. of ballot
papers issued
No. of votes
No. of votes: per list / valid [%]
total
valid
per List
1
City
20339
6955
6929
6433
163
2.53
2
Country
50976
17438
17427
16156
1112
6.88
.
Voting Results by number of inhabitants of commune
.
1
to 5 000
0
0
0
0
0
0.00
2
from 5 001 to 10 000
31051
10649
10638
9817
768
7.82
3
from 10 001 to 20 000
22098
8096
8087
7514
162
2.16
4
from 20 001 to 50 000
18166
5648
5631
5258
345
6.56
5
from 50 001 to 100 000
0
0
0
0
0
0.00
6
from 100 001 to 200 000
0
0
0
0
0
0.00
7
from 200 001 to 500 000
0
0
0
0
0
0.00
8
over 500 000
0
0
0
0
0
0.00
Legal Acts
Documents
Electoral Bodies
Election Committees
Turnout
Results
Statistical Data
SENATE
PRESIDENT
Created by
Copyright [c] 2005
Mikrobit Sp. z o.o.
. All Rights Reserved.
top