.
.
Legal Acts
Documents
Electoral Bodies
Election Committees
Turnout
Results
Statistical Data
SENATE
PRESIDENT
Created by
.
.
Voting Results
.
.
.
Voting Results for Committee
.
.
.
.
.
.
.
.
.
.
.
.
.
.
.
.
.
.
.
.
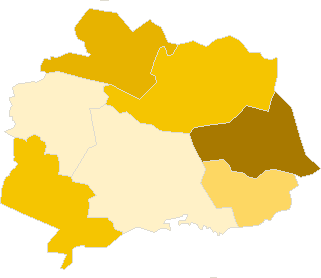
Polska
/
Kraków
/
miechowski, pow.
...
Komitet Wyborczy Samoobrona Rzeczpospolitej Polskiej
List's Number:
15
No. of valid votes:
13951
No. of votes per List:
3050
21.86%
lack
15.10%
17.21%
19.32%
21.43%
23.54%
25.65%
27.76%
29.87%
31.98%
34.09%
not
.
.
.
.
.
.
.
.
.
.
.
.
of data
17.20%
19.31%
21.42%
23.53%
25.64%
27.75%
29.86%
31.97%
34.08%
36.20%
applicable
See also:
Turnout
Votes per Lists
Votes per Candidates
Information about Election Committee
Election results
Voting Results by location of ward electoral commission
.
.
Voting Results for Committee.
.
.
.
.
.
.
.
.
.
.
.
.
.
.
.
.
.
No.
Name
No. of entitled
to vote
No. of ballot papers
issued
No. of votes
No. of votes: per list / valid [%]
total
valid
per List
120801
Charsznica, gm.
6348
2377
2376
2310
349
15.11
120802
Gołcza, gm.
5050
1870
1870
1758
523
29.75
120803
Kozłów, gm.
4040
1226
1222
1196
361
30.18
120804
Książ Wielki, gm.
4495
1573
1573
1507
421
27.94
120805
Miechów, gm.
16295
5759
5746
5541
872
15.74
120806
Racławice, gm.
2045
609
609
585
143
24.44
120807
Słaboszów, gm.
3221
1112
1112
1054
381
36.15
miechowski, pow.
41494
14526
14508
13951
3050
21.86
.
.
Voting Results for Candidates
.
.
.
.
.
.
.
.
.
.
.
.
.
.
.
No.
Surname Names
No. of votes
% No. of votes per candidate/No. per list
% No. of votes per candidate/No. of valid votes
1
TOKAJ Eugeniusz Jacek
605
19.83
4.34
2
WÓJCIK Kazimierz Marian
763
25.01
5.47
3
CZARSKI Mieczysław
138
4.52
0.99
4
PLUCIŃSKI Leon Krzysztof
47
1.54
0.34
5
RYBIAŁEK Bogumiła Maria
49
1.60
0.35
6
PALEJ Jerzy
42
1.37
0.30
7
SMĘDER Michał Dariusz
25
0.81
0.18
8
ŁYSEK Józef
157
5.14
1.13
9
WALASZEK Stanisław
36
1.18
0.26
10
KWINTA Arkadiusz Sebastian
37
1.21
0.27
11
SOLARZ Bogdan
77
2.52
0.55
12
DWORAK Stanisław
52
1.70
0.37
13
KASPRZAK Janina
28
0.91
0.20
14
HÜBNER Elżbieta
20
0.65
0.14
15
MIGAS Marzena Elżbieta
166
5.44
1.19
16
GODZIC Ireneusz
23
0.75
0.16
17
PISKORZ Bolesław
18
0.59
0.13
18
NIEGOWSKI Ireneusz Władysław
11
0.36
0.08
19
ZIÓŁKOWSKA Małgorzata
26
0.85
0.19
20
LICHOW Jan Marian
3
0.09
0.02
21
DUBAS Marek Kazimierz
291
9.54
2.09
22
DĄBROWSKI Grzegorz
185
6.06
1.33
23
BROCZKOWSKI Jarosław
7
0.22
0.05
24
CHWASTEK Tadeusz Kazimierz
185
6.06
1.33
25
POLAK Wiktoria
34
1.11
0.24
26
KASPRZYCKA Stanisława Marzena
25
0.81
0.18
Σ
3050
100.00
21.86
.
.
Voting Results by location of ward electoral commission.
.
.
.
.
.
.
.
.
.
.
.
.
.
.
.
.
.
No.
Name
No. of entitled
to vote
No. of ballot
papers issued
No. of votes
No. of votes: per list / valid [%]
total
valid
per List
1
City
9852
3977
3965
3821
294
7.69
2
Country
31642
10549
10543
10130
2756
27.21
.
Voting Results by number of inhabitants of commune
.
1
to 5 000
5266
1721
1721
1639
524
31.97
2
from 5 001 to 10 000
19933
7046
7041
6771
1654
24.43
3
from 10 001 to 20 000
0
0
0
0
0
0.00
4
from 20 001 to 50 000
16295
5759
5746
5541
872
15.74
5
from 50 001 to 100 000
0
0
0
0
0
0.00
6
from 100 001 to 200 000
0
0
0
0
0
0.00
7
from 200 001 to 500 000
0
0
0
0
0
0.00
8
over 500 000
0
0
0
0
0
0.00
Legal Acts
Documents
Electoral Bodies
Election Committees
Turnout
Results
Statistical Data
SENATE
PRESIDENT
Created by
Copyright [c] 2005
Mikrobit Sp. z o.o.
. All Rights Reserved.
top