.
.
Legal Acts
Documents
Electoral Bodies
Election Committees
Turnout
Results
Statistical Data
SENATE
PRESIDENT
Created by
.
.
Voting Results
.
.
.
Voting Results for Committee
.
.
.
.
.
.
.
.
.
.
.
.
.
.
.
.
.
.
.
.
Polska
/
Lublin
/
rycki, pow.
...
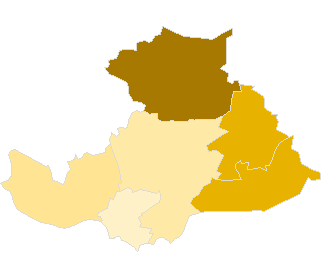
Komitet Wyborczy Samoobrona Rzeczpospolitej Polskiej
List's Number:
15
No. of valid votes:
18899
No. of votes per List:
3563
18.85%
lack
12.87%
14.96%
17.05%
19.14%
21.23%
23.32%
25.41%
27.50%
29.59%
31.68%
not
.
.
.
.
.
.
.
.
.
.
.
.
of data
14.95%
17.04%
19.13%
21.22%
23.31%
25.40%
27.49%
29.58%
31.67%
33.77%
applicable
See also:
Turnout
Votes per Lists
Votes per Candidates
Information about Election Committee
Election results
Voting Results by location of ward electoral commission
.
.
Voting Results for Committee.
.
.
.
.
.
.
.
.
.
.
.
.
.
.
.
.
.
No.
Name
No. of entitled
to vote
No. of ballot papers
issued
No. of votes
No. of votes: per list / valid [%]
total
valid
per List
061601
Dęblin, m.
14867
5915
5901
5656
728
12.87
061602
Kłoczew, gm.
5850
2411
2410
2285
771
33.74
061603
Nowodwór, gm.
3291
1381
1381
1313
372
28.33
061604
Ryki, gm.
16785
7009
7005
6689
1043
15.59
061605
Stężyca, gm.
4472
1868
1863
1757
308
17.53
061606
Ułęż, gm.
2902
1274
1273
1199
341
28.44
rycki, pow.
48167
19858
19833
18899
3563
18.85
.
.
Voting Results for Candidates
.
.
.
.
.
.
.
.
.
.
.
.
.
.
.
No.
Surname Names
No. of votes
% No. of votes per candidate/No. per list
% No. of votes per candidate/No. of valid votes
1
BORYSIUK Bolesław Borys
393
11.03
2.08
2
KOŁODZIEJCZYK Marek
353
9.90
1.87
3
KRZYSZCZAK Józef
93
2.61
0.49
4
GUT Alina
688
19.30
3.64
5
SKÓRSKI Stefan
45
1.26
0.24
6
SALCZYŃSKI Sławomir
39
1.09
0.21
7
STAREK Tomasz Józef
35
0.98
0.19
8
WIDZ Marian Andrzej
24
0.67
0.13
9
TAŁĘDA Julian Michał
16
0.44
0.08
10
WARCHULSKI Bogusław
40
1.12
0.21
11
KAWKA Zdzisław
69
1.93
0.37
12
MATACZ Dariusz Janusz
19
0.53
0.10
13
KRAWCZYK Witold
978
27.44
5.17
14
ŚWITAŁA Franciszek Marian
14
0.39
0.07
15
KOPEĆ Tadeusz Stefan
77
2.16
0.41
16
KOWALIK Piotr Dawid
47
1.31
0.25
17
RYMARZ Stanisław
28
0.78
0.15
18
SŁONIECKI Andrzej
6
0.16
0.03
19
GOLUCH Wiesława Grażyna
156
4.37
0.83
20
ŁOMNICKI Marian Henryk
8
0.22
0.04
21
CHABROS Andrzej Marcin
14
0.39
0.07
22
DUDZIAK Henryk
47
1.31
0.25
23
JUCHNIKOWSKI Józef Stanisław
2
0.05
0.01
24
SIENKIEWICZ Dariusz
163
4.57
0.86
25
KŁOS Józef Leszek
34
0.95
0.18
26
LIPKA Jadwiga Henryka
35
0.98
0.19
27
SZEWCZAK Rafał Ariel
13
0.36
0.07
28
WOŹNIAK Jan
37
1.03
0.20
29
MAZUREK Wioletta
49
1.37
0.26
30
REMBIELIŃSKA-SŁONIECKA Magdalena
41
1.15
0.22
Σ
3563
100.00
18.85
.
.
Voting Results by location of ward electoral commission.
.
.
.
.
.
.
.
.
.
.
.
.
.
.
.
.
.
No.
Name
No. of entitled
to vote
No. of ballot
papers issued
No. of votes
No. of votes: per list / valid [%]
total
valid
per List
1
City
23235
9498
9481
9101
1043
11.46
2
Country
24932
10360
10352
9798
2520
25.72
.
Voting Results by number of inhabitants of commune
.
1
to 5 000
6193
2655
2654
2512
713
28.38
2
from 5 001 to 10 000
10322
4279
4273
4042
1079
26.69
3
from 10 001 to 20 000
14867
5915
5901
5656
728
12.87
4
from 20 001 to 50 000
16785
7009
7005
6689
1043
15.59
5
from 50 001 to 100 000
0
0
0
0
0
0.00
6
from 100 001 to 200 000
0
0
0
0
0
0.00
7
from 200 001 to 500 000
0
0
0
0
0
0.00
8
over 500 000
0
0
0
0
0
0.00
Legal Acts
Documents
Electoral Bodies
Election Committees
Turnout
Results
Statistical Data
SENATE
PRESIDENT
Created by
Copyright [c] 2005
Mikrobit Sp. z o.o.
. All Rights Reserved.
top