.
.
Legal Acts
Documents
Electoral Bodies
Election Committees
Turnout
Results
Statistical Data
SENATE
PRESIDENT
Created by
.
.
Voting Results
.
.
.
Voting Results for Committee
.
.
.
.
.
.
.
.
.
.
.
.
.
.
.
.
.
.
.
.
Polska
/
Lublin
/
opolski, pow.
...
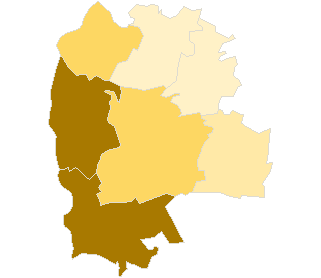
Komitet Wyborczy Samoobrona Rzeczpospolitej Polskiej
List's Number:
15
No. of valid votes:
18436
No. of votes per List:
5157
27.97%
lack
18.39%
20.88%
23.37%
25.86%
28.35%
30.84%
33.33%
35.82%
38.31%
40.80%
not
.
.
.
.
.
.
.
.
.
.
.
.
of data
20.87%
23.36%
25.85%
28.34%
30.83%
33.32%
35.81%
38.30%
40.79%
43.29%
applicable
See also:
Turnout
Votes per Lists
Votes per Candidates
Information about Election Committee
Election results
Voting Results by location of ward electoral commission
.
.
Voting Results for Committee.
.
.
.
.
.
.
.
.
.
.
.
.
.
.
.
.
.
No.
Name
No. of entitled
to vote
No. of ballot papers
issued
No. of votes
No. of votes: per list / valid [%]
total
valid
per List
061201
Chodel, gm.
5158
2226
2226
2124
464
21.85
061202
Józefów nad Wisłą, gm.
5784
2085
2084
2012
869
43.19
061203
Karczmiska, gm.
4841
1686
1685
1610
329
20.43
061204
Łaziska, gm.
4300
1621
1621
1573
652
41.45
061205
Opole Lubelskie, gm.
14422
5188
5164
4926
1517
30.80
061206
Poniatowa, gm.
12629
4859
4855
4680
861
18.40
061207
Wilków, gm.
3973
1586
1585
1511
465
30.77
opolski, pow.
51107
19251
19220
18436
5157
27.97
.
.
Voting Results for Candidates
.
.
.
.
.
.
.
.
.
.
.
.
.
.
.
No.
Surname Names
No. of votes
% No. of votes per candidate/No. per list
% No. of votes per candidate/No. of valid votes
1
BORYSIUK Bolesław Borys
556
10.78
3.02
2
KOŁODZIEJCZYK Marek
499
9.67
2.71
3
KRZYSZCZAK Józef
67
1.29
0.36
4
GUT Alina
697
13.51
3.78
5
SKÓRSKI Stefan
375
7.27
2.03
6
SALCZYŃSKI Sławomir
727
14.09
3.94
7
STAREK Tomasz Józef
119
2.30
0.65
8
WIDZ Marian Andrzej
28
0.54
0.15
9
TAŁĘDA Julian Michał
32
0.62
0.17
10
WARCHULSKI Bogusław
80
1.55
0.43
11
KAWKA Zdzisław
50
0.96
0.27
12
MATACZ Dariusz Janusz
37
0.71
0.20
13
KRAWCZYK Witold
57
1.10
0.31
14
ŚWITAŁA Franciszek Marian
29
0.56
0.16
15
KOPEĆ Tadeusz Stefan
79
1.53
0.43
16
KOWALIK Piotr Dawid
38
0.73
0.21
17
RYMARZ Stanisław
32
0.62
0.17
18
SŁONIECKI Andrzej
16
0.31
0.09
19
GOLUCH Wiesława Grażyna
31
0.60
0.17
20
ŁOMNICKI Marian Henryk
40
0.77
0.22
21
CHABROS Andrzej Marcin
22
0.42
0.12
22
DUDZIAK Henryk
1122
21.75
6.09
23
JUCHNIKOWSKI Józef Stanisław
13
0.25
0.07
24
SIENKIEWICZ Dariusz
208
4.03
1.13
25
KŁOS Józef Leszek
33
0.63
0.18
26
LIPKA Jadwiga Henryka
32
0.62
0.17
27
SZEWCZAK Rafał Ariel
12
0.23
0.07
28
WOŹNIAK Jan
42
0.81
0.23
29
MAZUREK Wioletta
48
0.93
0.26
30
REMBIELIŃSKA-SŁONIECKA Magdalena
36
0.69
0.20
Σ
5157
100.00
27.97
.
.
Voting Results by location of ward electoral commission.
.
.
.
.
.
.
.
.
.
.
.
.
.
.
.
.
.
No.
Name
No. of entitled
to vote
No. of ballot
papers issued
No. of votes
No. of votes: per list / valid [%]
total
valid
per List
1
City
12484
4854
4850
4701
731
15.55
2
Country
38623
14397
14370
13735
4426
32.22
.
Voting Results by number of inhabitants of commune
.
1
to 5 000
0
0
0
0
0
0.00
2
from 5 001 to 10 000
24056
9204
9201
8830
2779
31.47
3
from 10 001 to 20 000
27051
10047
10019
9606
2378
24.76
4
from 20 001 to 50 000
0
0
0
0
0
0.00
5
from 50 001 to 100 000
0
0
0
0
0
0.00
6
from 100 001 to 200 000
0
0
0
0
0
0.00
7
from 200 001 to 500 000
0
0
0
0
0
0.00
8
over 500 000
0
0
0
0
0
0.00
Legal Acts
Documents
Electoral Bodies
Election Committees
Turnout
Results
Statistical Data
SENATE
PRESIDENT
Created by
Copyright [c] 2005
Mikrobit Sp. z o.o.
. All Rights Reserved.
top