.
.
Legal Acts
Documents
Electoral Bodies
Election Committees
Turnout
Results
Statistical Data
SENATE
PRESIDENT
Created by
.
.
Voting Results
.
.
.
Voting Results for Committee
.
.
.
.
.
.
.
.
.
.
.
.
.
.
.
.
.
.
.
.
Polska
/
Lublin
/
janowski, pow.
...
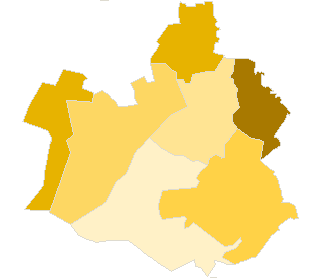
Komitet Wyborczy Samoobrona Rzeczpospolitej Polskiej
List's Number:
15
No. of valid votes:
17773
No. of votes per List:
2980
16.77%
lack
6.80%
9.53%
12.26%
14.99%
17.72%
20.45%
23.18%
25.91%
28.64%
31.37%
not
.
.
.
.
.
.
.
.
.
.
.
.
of data
9.52%
12.25%
14.98%
17.71%
20.44%
23.17%
25.90%
28.63%
31.36%
34.10%
applicable
See also:
Turnout
Votes per Lists
Votes per Candidates
Information about Election Committee
Election results
Voting Results by location of ward electoral commission
.
.
Voting Results for Committee.
.
.
.
.
.
.
.
.
.
.
.
.
.
.
.
.
.
No.
Name
No. of entitled
to vote
No. of ballot papers
issued
No. of votes
No. of votes: per list / valid [%]
total
valid
per List
060501
Batorz, gm.
2854
1288
1288
1212
342
28.22
060502
Chrzanów, gm.
2582
1419
1418
1383
471
34.06
060503
Dzwola, gm.
5342
2368
2367
2290
522
22.79
060504
Godziszów, gm.
4921
3299
3293
3235
403
12.46
060505
Janów Lubelski, gm.
13001
6092
6092
5892
401
6.81
060506
Modliborzyce, gm.
5859
2538
2535
2452
472
19.25
060507
Potok Wielki, gm.
3817
1390
1388
1309
369
28.19
janowski, pow.
38376
18394
18381
17773
2980
16.77
.
.
Voting Results for Candidates
.
.
.
.
.
.
.
.
.
.
.
.
.
.
.
No.
Surname Names
No. of votes
% No. of votes per candidate/No. per list
% No. of votes per candidate/No. of valid votes
1
BORYSIUK Bolesław Borys
359
12.04
2.02
2
KOŁODZIEJCZYK Marek
159
5.33
0.89
3
KRZYSZCZAK Józef
55
1.84
0.31
4
GUT Alina
329
11.04
1.85
5
SKÓRSKI Stefan
60
2.01
0.34
6
SALCZYŃSKI Sławomir
29
0.97
0.16
7
STAREK Tomasz Józef
48
1.61
0.27
8
WIDZ Marian Andrzej
1296
43.48
7.29
9
TAŁĘDA Julian Michał
39
1.30
0.22
10
WARCHULSKI Bogusław
39
1.30
0.22
11
KAWKA Zdzisław
27
0.90
0.15
12
MATACZ Dariusz Janusz
77
2.58
0.43
13
KRAWCZYK Witold
38
1.27
0.21
14
ŚWITAŁA Franciszek Marian
12
0.40
0.07
15
KOPEĆ Tadeusz Stefan
39
1.30
0.22
16
KOWALIK Piotr Dawid
40
1.34
0.23
17
RYMARZ Stanisław
10
0.33
0.06
18
SŁONIECKI Andrzej
3
0.10
0.02
19
GOLUCH Wiesława Grażyna
35
1.17
0.20
20
ŁOMNICKI Marian Henryk
22
0.73
0.12
21
CHABROS Andrzej Marcin
11
0.36
0.06
22
DUDZIAK Henryk
38
1.27
0.21
23
JUCHNIKOWSKI Józef Stanisław
4
0.13
0.02
24
SIENKIEWICZ Dariusz
62
2.08
0.35
25
KŁOS Józef Leszek
22
0.73
0.12
26
LIPKA Jadwiga Henryka
31
1.04
0.17
27
SZEWCZAK Rafał Ariel
12
0.40
0.07
28
WOŹNIAK Jan
26
0.87
0.15
29
MAZUREK Wioletta
32
1.07
0.18
30
REMBIELIŃSKA-SŁONIECKA Magdalena
26
0.87
0.15
Σ
2980
100.00
16.76
.
.
Voting Results by location of ward electoral commission.
.
.
.
.
.
.
.
.
.
.
.
.
.
.
.
.
.
No.
Name
No. of entitled
to vote
No. of ballot
papers issued
No. of votes
No. of votes: per list / valid [%]
total
valid
per List
1
City
10724
5021
5021
4869
257
5.28
2
Country
27652
13373
13360
12904
2723
21.10
.
Voting Results by number of inhabitants of commune
.
1
to 5 000
5436
2707
2706
2595
813
31.33
2
from 5 001 to 10 000
19939
9595
9583
9286
1766
19.02
3
from 10 001 to 20 000
13001
6092
6092
5892
401
6.81
4
from 20 001 to 50 000
0
0
0
0
0
0.00
5
from 50 001 to 100 000
0
0
0
0
0
0.00
6
from 100 001 to 200 000
0
0
0
0
0
0.00
7
from 200 001 to 500 000
0
0
0
0
0
0.00
8
over 500 000
0
0
0
0
0
0.00
Legal Acts
Documents
Electoral Bodies
Election Committees
Turnout
Results
Statistical Data
SENATE
PRESIDENT
Created by
Copyright [c] 2005
Mikrobit Sp. z o.o.
. All Rights Reserved.
top