.
.
Legal Acts
Documents
Electoral Bodies
Election Committees
Turnout
Results
Statistical Data
SENATE
PRESIDENT
Created by
.
.
Voting Results
.
.
.
Voting Results for Committee
.
.
.
.
.
.
.
.
.
.
.
.
.
.
.
.
.
.
.
.
Polska
/
Toruń
/
grudziądzki, pow.
...
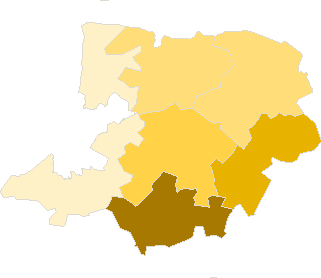
Komitet Wyborczy Samoobrona Rzeczpospolitej Polskiej
List's Number:
15
No. of valid votes:
8617
No. of votes per List:
3144
36.49%
lack
28.30%
30.26%
32.22%
34.18%
36.14%
38.10%
40.06%
42.02%
43.98%
45.94%
not
.
.
.
.
.
.
.
.
.
.
.
.
of data
30.25%
32.21%
34.17%
36.13%
38.09%
40.05%
42.01%
43.97%
45.93%
47.90%
applicable
See also:
Turnout
Votes per Lists
Votes per Candidates
Information about Election Committee
Election results
Voting Results by location of ward electoral commission
.
.
Voting Results for Committee.
.
.
.
.
.
.
.
.
.
.
.
.
.
.
.
.
.
No.
Name
No. of entitled
to vote
No. of ballot papers
issued
No. of votes
No. of votes: per list / valid [%]
total
valid
per List
040601
Grudziądz, gm.
7913
2336
2336
2236
633
28.31
040602
Gruta, gm.
5080
1510
1510
1459
561
38.45
040603
Łasin, gm.
6544
2135
2120
2011
707
35.16
040604
Radzyń Chełmiński, gm.
3719
1198
1198
1135
543
47.84
040605
Rogóźno, gm.
3106
884
875
843
295
34.99
040606
Świecie nad Osą, gm.
3412
984
985
933
405
43.41
grudziądzki, pow.
29774
9047
9024
8617
3144
36.49
.
.
Voting Results for Candidates
.
.
.
.
.
.
.
.
.
.
.
.
.
.
.
No.
Surname Names
No. of votes
% No. of votes per candidate/No. per list
% No. of votes per candidate/No. of valid votes
1
KRAJEWSKI Mirosław
309
9.82
3.59
2
SUŁEK Leszek Kazimierz
1068
33.96
12.39
3
KUROPATWIŃSKI Lech Stefan
63
2.00
0.73
4
OBUCHOWSKA Ewa
113
3.59
1.31
5
NOWAKOWSKI Waldemar
94
2.98
1.09
6
CENTKOWSKI Sławomir
33
1.04
0.38
7
JANKOWSKI Stefan
94
2.98
1.09
8
CHMIELEWSKI Marek Henryk
66
2.09
0.77
9
BIERNACKI Grzegorz
39
1.24
0.45
10
WOLSKI Piotr Aleksander
117
3.72
1.36
11
SCHROEDER Krzysztof Gerard
54
1.71
0.63
12
MŁODZIANKIEWICZ Wiesław
15
0.47
0.17
13
KOZŁOWSKA Sylwia Dorota
511
16.25
5.93
14
WÓJCIK Kazimierz
25
0.79
0.29
15
CZEPEK Stanisław Franciszek
89
2.83
1.03
16
PIETRZAK Adam
23
0.73
0.27
17
DUSZYŃSKI Marek Bolesław
244
7.76
2.83
18
GOŁĘBIEWSKI Marian Krzysztof
20
0.63
0.23
19
TRYBUŁA Roman
9
0.28
0.10
20
PARADZIŃSKI Zdzisław
3
0.09
0.03
21
WIERZOWIECKI Zygmunt
3
0.09
0.03
22
SIEMIANOWSKI Józef Jerzy
58
1.84
0.67
23
RUTKOWSKI Andrzej
76
2.41
0.88
24
TRACZYKOWSKI Zbigniew
18
0.57
0.21
Σ
3144
100.00
36.48
.
.
Voting Results by location of ward electoral commission.
.
.
.
.
.
.
.
.
.
.
.
.
.
.
.
.
.
No.
Name
No. of entitled
to vote
No. of ballot
papers issued
No. of votes
No. of votes: per list / valid [%]
total
valid
per List
1
City
5143
1838
1837
1724
521
30.22
2
Country
24631
7209
7187
6893
2623
38.05
.
Voting Results by number of inhabitants of commune
.
1
to 5 000
6518
1868
1860
1776
700
39.41
2
from 5 001 to 10 000
15343
4843
4828
4605
1811
39.33
3
from 10 001 to 20 000
7913
2336
2336
2236
633
28.31
4
from 20 001 to 50 000
0
0
0
0
0
0.00
5
from 50 001 to 100 000
0
0
0
0
0
0.00
6
from 100 001 to 200 000
0
0
0
0
0
0.00
7
from 200 001 to 500 000
0
0
0
0
0
0.00
8
over 500 000
0
0
0
0
0
0.00
Legal Acts
Documents
Electoral Bodies
Election Committees
Turnout
Results
Statistical Data
SENATE
PRESIDENT
Created by
Copyright [c] 2005
Mikrobit Sp. z o.o.
. All Rights Reserved.
top