.
.
Legal Acts
Documents
Electoral Bodies
Election Committees
Turnout
Results
Statistical Data
SENATE
PRESIDENT
Created by
.
.
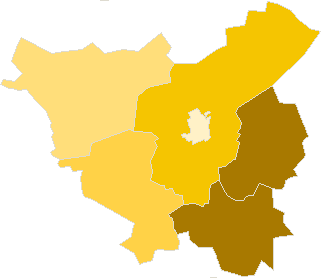
Voting Results
.
.
.
Voting Results for Committee
.
.
.
.
.
.
.
.
.
.
.
.
.
.
.
.
.
.
.
.
Polska
/
Toruń
/
golubsko-dobrzyński, pow.
...
Komitet Wyborczy Samoobrona Rzeczpospolitej Polskiej
List's Number:
15
No. of valid votes:
10997
No. of votes per List:
3300
30.01%
lack
14.50%
18.11%
21.72%
25.33%
28.94%
32.55%
36.16%
39.77%
43.38%
46.99%
not
.
.
.
.
.
.
.
.
.
.
.
.
of data
18.10%
21.71%
25.32%
28.93%
32.54%
36.15%
39.76%
43.37%
46.98%
50.60%
applicable
See also:
Turnout
Votes per Lists
Votes per Candidates
Information about Election Committee
Election results
Voting Results by location of ward electoral commission
.
.
Voting Results for Committee.
.
.
.
.
.
.
.
.
.
.
.
.
.
.
.
.
.
No.
Name
No. of entitled
to vote
No. of ballot papers
issued
No. of votes
No. of votes: per list / valid [%]
total
valid
per List
040502
Ciechocin, gm.
2932
972
972
918
307
33.44
040503
Golub-Dobrzyń, gm.
6252
1827
1827
1741
668
38.37
040501
Golub-Dobrzyń, m.
9944
3645
3643
3496
507
14.50
040504
Kowalewo Pomorskie, gm.
8681
2955
2954
2827
803
28.40
040505
Radomin, gm.
3146
1007
1007
984
494
50.20
040506
Zbójno, gm.
3366
1069
1069
1031
521
50.53
golubsko-dobrzyński, pow.
34321
11475
11472
10997
3300
30.01
.
.
Voting Results for Candidates
.
.
.
.
.
.
.
.
.
.
.
.
.
.
.
No.
Surname Names
No. of votes
% No. of votes per candidate/No. per list
% No. of votes per candidate/No. of valid votes
1
KRAJEWSKI Mirosław
555
16.81
5.05
2
SUŁEK Leszek Kazimierz
139
4.21
1.26
3
KUROPATWIŃSKI Lech Stefan
128
3.87
1.16
4
OBUCHOWSKA Ewa
120
3.63
1.09
5
NOWAKOWSKI Waldemar
133
4.03
1.21
6
CENTKOWSKI Sławomir
92
2.78
0.84
7
JANKOWSKI Stefan
91
2.75
0.83
8
CHMIELEWSKI Marek Henryk
62
1.87
0.56
9
BIERNACKI Grzegorz
53
1.60
0.48
10
WOLSKI Piotr Aleksander
581
17.60
5.28
11
SCHROEDER Krzysztof Gerard
24
0.72
0.22
12
MŁODZIANKIEWICZ Wiesław
445
13.48
4.05
13
KOZŁOWSKA Sylwia Dorota
195
5.90
1.77
14
WÓJCIK Kazimierz
42
1.27
0.38
15
CZEPEK Stanisław Franciszek
52
1.57
0.47
16
PIETRZAK Adam
128
3.87
1.16
17
DUSZYŃSKI Marek Bolesław
13
0.39
0.12
18
GOŁĘBIEWSKI Marian Krzysztof
41
1.24
0.37
19
TRYBUŁA Roman
17
0.51
0.15
20
PARADZIŃSKI Zdzisław
217
6.57
1.97
21
WIERZOWIECKI Zygmunt
18
0.54
0.16
22
SIEMIANOWSKI Józef Jerzy
28
0.84
0.25
23
RUTKOWSKI Andrzej
61
1.84
0.55
24
TRACZYKOWSKI Zbigniew
65
1.96
0.59
Σ
3300
100.00
30.00
.
.
Voting Results by location of ward electoral commission.
.
.
.
.
.
.
.
.
.
.
.
.
.
.
.
.
.
No.
Name
No. of entitled
to vote
No. of ballot
papers issued
No. of votes
No. of votes: per list / valid [%]
total
valid
per List
1
City
13983
5202
5199
4990
823
16.49
2
Country
20338
6273
6273
6007
2477
41.24
.
Voting Results by number of inhabitants of commune
.
1
to 5 000
9444
3048
3048
2933
1322
45.07
2
from 5 001 to 10 000
6252
1827
1827
1741
668
38.37
3
from 10 001 to 20 000
18625
6600
6597
6323
1310
20.72
4
from 20 001 to 50 000
0
0
0
0
0
0.00
5
from 50 001 to 100 000
0
0
0
0
0
0.00
6
from 100 001 to 200 000
0
0
0
0
0
0.00
7
from 200 001 to 500 000
0
0
0
0
0
0.00
8
over 500 000
0
0
0
0
0
0.00
Legal Acts
Documents
Electoral Bodies
Election Committees
Turnout
Results
Statistical Data
SENATE
PRESIDENT
Created by
Copyright [c] 2005
Mikrobit Sp. z o.o.
. All Rights Reserved.
top