| . |
. |
Voting Results for Committee |
. |
. |
| . |
. |
| . |
. |
. |
. |
. |
. |
. |
. |
. |
. |
. |
. |
. |
. |
. |
. |
| Polska / Gdańsk / starogardzki, pow. ... |
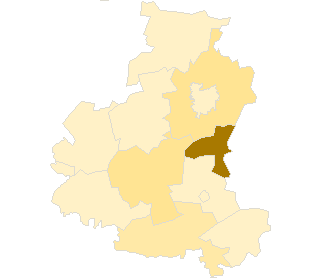 |
| Komitet Wyborczy Dom Ojczysty |
| List's Number: |
17 |
| No. of valid votes: |
34611 |
| No. of votes per List: |
211 |
0.61% |
|
| lack | 0.38% | 0.69% | 1.00% | 1.31% | 1.62% | 1.93% | 2.24% | 2.55% | 2.86% | 3.17% | not | | . | . | . | . | . | . | . | . | . | . | . | . | | of data | 0.68% | 0.99% | 1.30% | 1.61% | 1.92% | 2.23% | 2.54% | 2.85% | 3.16% | 3.48% | applicable |
|
See also:
|
| . |
. |
Voting Results for Committee. |
. |
. |
| . |
. |
| . |
. |
. |
. |
. |
. |
. |
. |
. |
. |
. |
. |
. |
| No. |
Name |
No. of entitled
to vote |
No. of ballot papers
issued |
No. of votes |
No. of votes: per list / valid [%] |
| total |
valid |
per List |
| 221304 | Bobowo, gm. | 2092 | 755 | 754 | 697 | 24 | 3.44 |  |
| 221301 | Czarna Woda, m. | 2622 | 1137 | 1137 | 1087 | 6 | 0.55 | |
| 221305 | Kaliska, gm. | 3783 | 1389 | 1389 | 1311 | 5 | 0.38 | |
| 221306 | Lubichowo, gm. | 4330 | 1672 | 1671 | 1584 | 20 | 1.26 | |
| 221307 | Osieczna, gm. | 2130 | 879 | 879 | 791 | 4 | 0.51 | |
| 221308 | Osiek, gm. | 2004 | 740 | 740 | 711 | 7 | 0.98 | |
| 221309 | Skarszewy, gm. | 10078 | 3678 | 3677 | 3522 | 14 | 0.40 | |
| 221310 | Skórcz, gm. | 3416 | 1240 | 1240 | 1167 | 8 | 0.69 | |
| 221302 | Skórcz, m. | 2555 | 1035 | 1035 | 975 | 5 | 0.51 | |
| 221311 | Smętowo Graniczne, gm. | 4027 | 1288 | 1287 | 1205 | 6 | 0.50 | |
| 221312 | Starogard Gdański, gm. | 9293 | 3805 | 3801 | 3595 | 39 | 1.08 | |
| 221303 | Starogard Gdański, m. | 38394 | 15662 | 15645 | 15206 | 58 | 0.38 | |
| 221313 | Zblewo, gm. | 7742 | 2896 | 2895 | 2760 | 15 | 0.54 | |
| |
starogardzki, pow. |
92466 |
36176 |
36150 |
34611 |
211 |
0.61 |
 |
|
| |
| . |
. |
Voting Results by location of ward electoral commission. |
. |
. |
| . |
. |
| . |
. |
. |
. |
. |
. |
. |
. |
. |
. |
. |
. |
. |
| No. |
Name |
No. of entitled
to vote |
No. of ballot
papers issued |
No. of votes |
No. of votes: per list / valid [%] |
| total |
valid |
per List |
| 1 | City | 49212 | 20021 | 20004 | 19376 | 79 | 0.41 | |
| 2 | Country | 43254 | 16155 | 16146 | 15235 | 132 | 0.87 | |
| . |
Voting Results by number of inhabitants of commune |
. |
| 1 | to 5 000 | 14819 | 5786 | 5785 | 5428 | 54 | 0.99 | |
| 2 | from 5 001 to 10 000 | 12140 | 4349 | 4347 | 4100 | 31 | 0.76 | |
| 3 | from 10 001 to 20 000 | 27113 | 10379 | 10373 | 9877 | 68 | 0.69 | |
| 4 | from 20 001 to 50 000 | 38394 | 15662 | 15645 | 15206 | 58 | 0.38 | |
| 5 | from 50 001 to 100 000 | 0 | 0 | 0 | 0 | 0 | 0.00 | |
| 6 | from 100 001 to 200 000 | 0 | 0 | 0 | 0 | 0 | 0.00 | |
| 7 | from 200 001 to 500 000 | 0 | 0 | 0 | 0 | 0 | 0.00 | |
| 8 | over 500 000 | 0 | 0 | 0 | 0 | 0 | 0.00 | |
|
|


 Legal Acts
 Legal Acts