.
.
Legal Acts
Documents
Electoral Bodies
Election Committees
Turnout
Results
Statistical Data
SENATE
PRESIDENT
Created by
.
.
Voting Results
.
.
.
Voting Results for Committee
.
.
.
.
.
.
.
.
.
.
.
.
.
.
.
.
.
.
.
.
Polska
/
Szczecin
/
łobeski, pow.
...
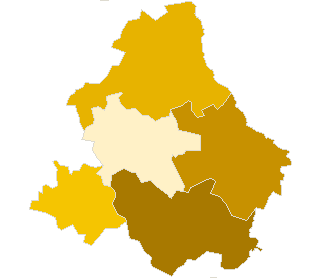
Komitet Wyborczy Prawo i Sprawiedliwość
List's Number:
6
No. of valid votes:
8600
No. of votes per List:
1610
18.72%
lack
9.88%
11.04%
12.20%
13.36%
14.52%
15.68%
16.84%
18.00%
19.16%
20.32%
not
.
.
.
.
.
.
.
.
.
.
.
.
of data
11.03%
12.19%
13.35%
14.51%
15.67%
16.83%
17.99%
19.15%
20.31%
21.48%
applicable
See also:
Turnout
Votes per Lists
Votes per Candidates
Information about Election Committee
Election results
Voting Results by location of ward electoral commission
.
.
Voting Results for Committee.
.
.
.
.
.
.
.
.
.
.
.
.
.
.
.
.
.
No.
Name
No. of entitled
to vote
No. of ballot papers
issued
No. of votes
No. of votes: per list / valid [%]
total
valid
per List
321801
Dobra, gm.
3591
808
808
760
135
17.76
321802
Łobez, gm.
11609
4035
4032
3849
742
19.28
321803
Radowo Małe, gm.
2981
691
691
668
66
9.88
321804
Resko, gm.
6586
1922
1892
1812
343
18.93
321805
Węgorzyno, gm.
5726
1592
1565
1511
324
21.44
łobeski, pow.
30493
9048
8988
8600
1610
18.72
.
.
Voting Results for Candidates
.
.
.
.
.
.
.
.
.
.
.
.
.
.
.
No.
Surname Names
No. of votes
% No. of votes per candidate/No. per list
% No. of votes per candidate/No. of valid votes
1
BRUDZIŃSKI Joachim Stanisław
231
14.34
2.69
2
DOBRZYŃSKI Leszek
85
5.27
0.99
3
JANIA Piotr Paweł
23
1.42
0.27
4
KLUKOWSKI Wacław
38
2.36
0.44
5
MASŁOWSKA Mirosława Jolanta
60
3.72
0.70
6
JACH Michał
41
2.54
0.48
7
DRZAZGA Kazimierz
22
1.36
0.26
8
MROZEK Andrzej
20
1.24
0.23
9
SAWARYN Mieczysław Edward
21
1.30
0.24
10
KOŁPACZYŃSKI Paweł
14
0.86
0.16
11
BIERNAT Stefania Elżbieta
45
2.79
0.52
12
ŁASZEWSKI Kazimierz Andrzej
17
1.05
0.20
13
TORZEWSKI Rafał Ryszard
30
1.86
0.35
14
KOSMAL Edward
32
1.98
0.37
15
SZYMAŃSKA Halina Barbara
745
46.27
8.66
16
WINNICKI Kazimierz
12
0.74
0.14
17
PRYSTUPA Józef Włodzimierz
6
0.37
0.07
18
PLAUGO Łucja Janina
3
0.18
0.03
19
KOREK Renata Teresa
18
1.11
0.21
20
KOPACKA Marzena Teresa
20
1.24
0.23
21
JUTRZENKA-TRZEBIATOWSKI Marek
10
0.62
0.12
22
MICHOŃSKA Alicja Bernarda
6
0.37
0.07
23
STANKIEWICZ Robert
19
1.18
0.22
24
KOPEĆ Maciej Stanisław
65
4.03
0.76
25
ZASADZKI Włodzimierz Andrzej
27
1.67
0.31
Σ
1610
100.00
18.72
.
.
Voting Results by location of ward electoral commission.
.
.
.
.
.
.
.
.
.
.
.
.
.
.
.
.
.
No.
Name
No. of entitled
to vote
No. of ballot
papers issued
No. of votes
No. of votes: per list / valid [%]
total
valid
per List
1
City
17406
5899
5869
5612
1216
21.67
2
Country
13087
3149
3119
2988
394
13.19
.
Voting Results by number of inhabitants of commune
.
1
to 5 000
6572
1499
1499
1428
201
14.08
2
from 5 001 to 10 000
12312
3514
3457
3323
667
20.07
3
from 10 001 to 20 000
11609
4035
4032
3849
742
19.28
4
from 20 001 to 50 000
0
0
0
0
0
0.00
5
from 50 001 to 100 000
0
0
0
0
0
0.00
6
from 100 001 to 200 000
0
0
0
0
0
0.00
7
from 200 001 to 500 000
0
0
0
0
0
0.00
8
over 500 000
0
0
0
0
0
0.00
Legal Acts
Documents
Electoral Bodies
Election Committees
Turnout
Results
Statistical Data
SENATE
PRESIDENT
Created by
Copyright [c] 2005
Mikrobit Sp. z o.o.
. All Rights Reserved.
top