| . |
. |
Voting Results for Committee |
. |
. |
| . |
. |
| . |
. |
. |
. |
. |
. |
. |
. |
. |
. |
. |
. |
. |
. |
. |
. |
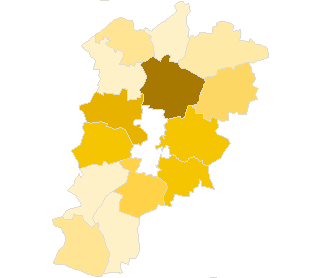
| Polska / Konin / koniński, pow. ... |
 |
| Komitet Wyborczy Prawo i Sprawiedliwość |
| List's Number: |
6 |
| No. of valid votes: |
29818 |
| No. of votes per List: |
5909 |
19.82% |
|
| lack | 15.09% | 16.15% | 17.21% | 18.27% | 19.33% | 20.39% | 21.45% | 22.51% | 23.57% | 24.63% | not | | . | . | . | . | . | . | . | . | . | . | . | . | | of data | 16.14% | 17.20% | 18.26% | 19.32% | 20.38% | 21.44% | 22.50% | 23.56% | 24.62% | 25.69% | applicable |
|
See also:
|
| . |
. |
Voting Results for Committee. |
. |
. |
| . |
. |
| . |
. |
. |
. |
. |
. |
. |
. |
. |
. |
. |
. |
. |
| No. |
Name |
No. of entitled
to vote |
No. of ballot papers
issued |
No. of votes |
No. of votes: per list / valid [%] |
| total |
valid |
per List |
| 301001 | Golina, gm. | 8755 | 3021 | 3017 | 2890 | 630 | 21.80 |  |
| 301002 | Grodziec, gm. | 3922 | 1212 | 1211 | 1149 | 207 | 18.02 | |
| 301003 | Kazimierz Biskupi, gm. | 7758 | 2675 | 2672 | 2556 | 601 | 23.51 | |
| 301004 | Kleczew, gm. | 7346 | 2596 | 2595 | 2405 | 363 | 15.09 | |
| 301005 | Kramsk, gm. | 7612 | 2458 | 2458 | 2342 | 518 | 22.12 | |
| 301006 | Krzymów, gm. | 5218 | 1877 | 1867 | 1770 | 381 | 21.53 | |
| 301007 | Rychwał, gm. | 6372 | 2326 | 2325 | 2152 | 341 | 15.85 | |
| 301008 | Rzgów, gm. | 5160 | 1732 | 1732 | 1662 | 260 | 15.64 | |
| 301009 | Skulsk, gm. | 4766 | 1378 | 1377 | 1301 | 199 | 15.30 | |
| 301010 | Sompolno, gm. | 8129 | 2772 | 2769 | 2644 | 520 | 19.67 | |
| 301011 | Stare Miasto, gm. | 7454 | 2823 | 2821 | 2679 | 557 | 20.79 | |
| 301012 | Ślesin, gm. | 10128 | 3110 | 3092 | 3011 | 773 | 25.67 | |
| 301013 | Wierzbinek, gm. | 5868 | 1809 | 1806 | 1695 | 283 | 16.70 | |
| 301014 | Wilczyn, gm. | 4872 | 1697 | 1695 | 1562 | 276 | 17.67 | |
| |
koniński, pow. |
93360 |
31486 |
31437 |
29818 |
5909 |
19.82 |
 |
|
| |
| . |
. |
Voting Results by location of ward electoral commission. |
. |
. |
| . |
. |
| . |
. |
. |
. |
. |
. |
. |
. |
. |
. |
. |
. |
. |
| No. |
Name |
No. of entitled
to vote |
No. of ballot
papers issued |
No. of votes |
No. of votes: per list / valid [%] |
| total |
valid |
per List |
| 1 | City | 14402 | 5518 | 5515 | 5252 | 1253 | 23.86 | |
| 2 | Country | 78958 | 25968 | 25922 | 24566 | 4656 | 18.95 | |
| . |
Voting Results by number of inhabitants of commune |
. |
| 1 | to 5 000 | 0 | 0 | 0 | 0 | 0 | 0.00 | |
| 2 | from 5 001 to 10 000 | 43524 | 14627 | 14608 | 13696 | 2310 | 16.87 | |
| 3 | from 10 001 to 20 000 | 49836 | 16859 | 16829 | 16122 | 3599 | 22.32 | |
| 4 | from 20 001 to 50 000 | 0 | 0 | 0 | 0 | 0 | 0.00 | |
| 5 | from 50 001 to 100 000 | 0 | 0 | 0 | 0 | 0 | 0.00 | |
| 6 | from 100 001 to 200 000 | 0 | 0 | 0 | 0 | 0 | 0.00 | |
| 7 | from 200 001 to 500 000 | 0 | 0 | 0 | 0 | 0 | 0.00 | |
| 8 | over 500 000 | 0 | 0 | 0 | 0 | 0 | 0.00 | |
|
|


 Legal Acts
 Legal Acts