.
.
Legal Acts
Documents
Electoral Bodies
Election Committees
Turnout
Results
Statistical Data
SENATE
PRESIDENT
Created by
.
.
Voting Results
.
.
.
Voting Results for Committee
.
.
.
.
.
.
.
.
.
.
.
.
.
.
.
.
.
.
.
.
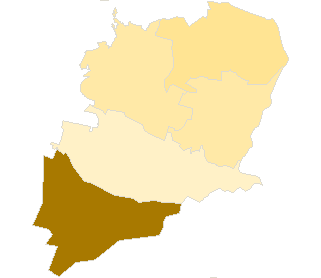
Polska
/
Katowice
/
bieruńsko-lędziński, pow.
...
Komitet Wyborczy Prawo i Sprawiedliwość
List's Number:
6
No. of valid votes:
18106
No. of votes per List:
7490
41.37%
lack
36.16%
38.31%
40.46%
42.61%
44.76%
46.91%
49.06%
51.21%
53.36%
55.51%
not
.
.
.
.
.
.
.
.
.
.
.
.
of data
38.30%
40.45%
42.60%
44.75%
46.90%
49.05%
51.20%
53.35%
55.50%
57.66%
applicable
See also:
Turnout
Votes per Lists
Votes per Candidates
Information about Election Committee
Election results
Voting Results by location of ward electoral commission
.
.
Voting Results for Committee.
.
.
.
.
.
.
.
.
.
.
.
.
.
.
.
.
.
No.
Name
No. of entitled
to vote
No. of ballot papers
issued
No. of votes
No. of votes: per list / valid [%]
total
valid
per List
241401
Bieruń, m.
15519
6436
6432
6178
2234
36.16
241404
Bojszowy, gm.
4989
2707
2707
2628
1513
57.57
241405
Chełm Śląski, gm.
4417
1934
1925
1865
720
38.61
241402
Imielin, m.
6169
2779
2778
2681
1130
42.15
241403
Lędziny, m.
12291
4984
4979
4754
1893
39.82
bieruńsko-lędziński, pow.
43385
18840
18821
18106
7490
41.37
.
.
Voting Results for Candidates
.
.
.
.
.
.
.
.
.
.
.
.
.
.
.
No.
Surname Names
No. of votes
% No. of votes per candidate/No. per list
% No. of votes per candidate/No. of valid votes
1
POLACZEK Jerzy Jan
1758
23.47
9.71
2
NOWAK Maria Teresa
296
3.95
1.63
3
MIKUŁA Krzysztof Józef
167
2.22
0.92
4
SIENICKI Jerzy Adam
126
1.68
0.70
5
SZWEDA Maria Weronika
270
3.60
1.49
6
LYSKO Alojzy Wiktor
3481
46.47
19.23
7
TOBISZOWSKI Grzegorz Józef
35
0.46
0.19
8
SOBCZYK Danuta Elżbieta
97
1.29
0.54
9
PIETRASZ Piotr Aleksander
48
0.64
0.27
10
FIERLA Damian Tomasz
262
3.49
1.45
11
ĆWIKOWSKI Damazy Henryk
37
0.49
0.20
12
JACENT Daniel Andrzej
36
0.48
0.20
13
WILLNER-PASTER Ryszard Adam
20
0.26
0.11
14
ŚLIWIŃSKI Henryk
540
7.20
2.98
15
GROBELKA Janusz Piotr
16
0.21
0.09
16
PAJER Tomasz Robert
30
0.40
0.17
17
PERSONA Mariusz Stanisław
13
0.17
0.07
18
GNIEŁKA Grzegorz Henryk
32
0.42
0.18
19
ZYMANEK Grzegorz Marian
39
0.52
0.22
20
KMINIKOWSKA Izabela Grażyna
23
0.30
0.13
21
KWIATEK Krzysztof Grzegorz
34
0.45
0.19
22
BUBAŁA Marek Piotr
25
0.33
0.14
23
BANASIEWICZ Beata Anna
55
0.73
0.30
24
POCZACHOWSKI Wojciech Jerzy
50
0.66
0.28
Σ
7490
100.00
41.36
.
.
Voting Results by location of ward electoral commission.
.
.
.
.
.
.
.
.
.
.
.
.
.
.
.
.
.
No.
Name
No. of entitled
to vote
No. of ballot
papers issued
No. of votes
No. of votes: per list / valid [%]
total
valid
per List
1
City
33979
14199
14189
13613
5257
38.62
2
Country
9406
4641
4632
4493
2233
49.70
.
Voting Results by number of inhabitants of commune
.
1
to 5 000
0
0
0
0
0
0.00
2
from 5 001 to 10 000
15575
7420
7410
7174
3363
46.88
3
from 10 001 to 20 000
27810
11420
11411
10932
4127
37.75
4
from 20 001 to 50 000
0
0
0
0
0
0.00
5
from 50 001 to 100 000
0
0
0
0
0
0.00
6
from 100 001 to 200 000
0
0
0
0
0
0.00
7
from 200 001 to 500 000
0
0
0
0
0
0.00
8
over 500 000
0
0
0
0
0
0.00
Legal Acts
Documents
Electoral Bodies
Election Committees
Turnout
Results
Statistical Data
SENATE
PRESIDENT
Created by
Copyright [c] 2005
Mikrobit Sp. z o.o.
. All Rights Reserved.
top