.
.
Legal Acts
Documents
Electoral Bodies
Election Committees
Turnout
Results
Statistical Data
SENATE
PRESIDENT
Created by
.
.
Voting Results
.
.
.
Voting Results for Committee
.
.
.
.
.
.
.
.
.
.
.
.
.
.
.
.
.
.
.
.
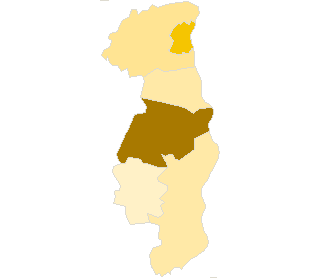
Polska
/
Gdańsk
/
tczewski, pow.
...
Komitet Wyborczy Prawo i Sprawiedliwość
List's Number:
6
No. of valid votes:
31080
No. of votes per List:
8410
27.06%
lack
17.63%
19.23%
20.83%
22.43%
24.03%
25.63%
27.23%
28.83%
30.43%
32.03%
not
.
.
.
.
.
.
.
.
.
.
.
.
of data
19.22%
20.82%
22.42%
24.02%
25.62%
27.22%
28.82%
30.42%
32.02%
33.63%
applicable
See also:
Turnout
Votes per Lists
Votes per Candidates
Information about Election Committee
Election results
Voting Results by location of ward electoral commission
.
.
Voting Results for Committee.
.
.
.
.
.
.
.
.
.
.
.
.
.
.
.
.
.
No.
Name
No. of entitled
to vote
No. of ballot papers
issued
No. of votes
No. of votes: per list / valid [%]
total
valid
per List
221402
Gniew, gm.
12203
3854
3852
3676
758
20.62
221403
Morzeszczyn, gm.
2767
872
872
811
143
17.63
221404
Pelplin, gm.
12492
4235
4234
4000
1342
33.55
221405
Subkowy, gm.
3702
1209
1209
1140
228
20.00
221406
Tczew, gm.
8197
2892
2892
2770
595
21.48
221401
Tczew, m.
46993
19355
19323
18683
5344
28.60
tczewski, pow.
86354
32417
32382
31080
8410
27.06
.
.
Voting Results for Candidates
.
.
.
.
.
.
.
.
.
.
.
.
.
.
.
No.
Surname Names
No. of votes
% No. of votes per candidate/No. per list
% No. of votes per candidate/No. of valid votes
1
CYMAŃSKI Tadeusz
1384
16.45
4.45
2
KURSKI Jacek Olgierd
2285
27.17
7.35
3
FOLTYN-KUBICKA Hanna
248
2.94
0.80
4
LISS Andrzej Marcelin
1679
19.96
5.40
5
NIKIEL Ryszard
68
0.80
0.22
6
SZMIENDOWSKI Jan
68
0.80
0.22
7
JAWORSKI Andrzej
218
2.59
0.70
8
LIBISZEWSKI Maciej Andrzej
1552
18.45
4.99
9
ŻÓŁTOWSKI Mariusz Jerzy
32
0.38
0.10
10
KASPERSKI Ryszard
44
0.52
0.14
11
KORALEWSKI Kazimierz Marian
28
0.33
0.09
12
MAKURAT Franciszek Edmund
105
1.24
0.34
13
CHRAPKIEWICZ Daniela Jadwiga
62
0.73
0.20
14
SIWIECKI Dariusz Bronisław
31
0.36
0.10
15
PLEWA Romuald Stanisław
38
0.45
0.12
16
SZCZERBOWICZ-LEWANDOWSKA Jolanta Ligia
89
1.05
0.29
17
KAŁUŻNY Andrzej
61
0.72
0.20
18
RAKOWIEC Robert
16
0.19
0.05
19
TEODORCZYK Jacek Włodzimierz
41
0.48
0.13
20
BIELESZ Tamara Elżbieta
53
0.63
0.17
21
KOMOROWSKI Jerzy
113
1.34
0.36
22
BOJKOWSKI Zbigniew
19
0.22
0.06
23
MAKOWIECKI Lech
73
0.86
0.23
24
MARCHLEWICZ Przemysław Jan
103
1.22
0.33
Σ
8410
100.00
27.05
.
.
Voting Results by location of ward electoral commission.
.
.
.
.
.
.
.
.
.
.
.
.
.
.
.
.
.
No.
Name
No. of entitled
to vote
No. of ballot
papers issued
No. of votes
No. of votes: per list / valid [%]
total
valid
per List
1
City
60214
23888
23855
22984
6737
29.31
2
Country
26140
8529
8527
8096
1673
20.66
.
Voting Results by number of inhabitants of commune
.
1
to 5 000
2767
872
872
811
143
17.63
2
from 5 001 to 10 000
3702
1209
1209
1140
228
20.00
3
from 10 001 to 20 000
32892
10981
10978
10446
2695
25.80
4
from 20 001 to 50 000
0
0
0
0
0
0.00
5
from 50 001 to 100 000
46993
19355
19323
18683
5344
28.60
6
from 100 001 to 200 000
0
0
0
0
0
0.00
7
from 200 001 to 500 000
0
0
0
0
0
0.00
8
over 500 000
0
0
0
0
0
0.00
Legal Acts
Documents
Electoral Bodies
Election Committees
Turnout
Results
Statistical Data
SENATE
PRESIDENT
Created by
Copyright [c] 2005
Mikrobit Sp. z o.o.
. All Rights Reserved.
top