.
.
 
. .
Voting Results
.
. . Voting Results for Committee . .
. .
. . . . . . . . . . . . . . . .
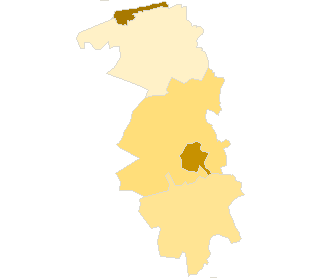
Polska / Gdynia / lęborski, pow. ...
Komitet Wyborczy Prawo i Sprawiedliwość
List's Number: 6
No. of valid votes: 17476
No. of votes per List: 3671
21.01%
lack13.57%14.68%15.79%16.90%18.01%19.12%20.23%21.34%22.45%23.56%not
............
of data14.67%15.78%16.89%18.00%19.11%20.22%21.33%22.44%23.55%24.67%applicable

See also:
. . Voting Results for Committee. . .
. .
. . . . . . . . . . . . .
No. Name No. of entitled
to vote
No. of ballot papers
issued
No. of votes No. of votes: per list / valid [%]
total valid per List
220803Cewice, gm.510317171716163727616.86
220801Lębork, m.27673109681096210554241522.88
220802Łeba, m.325813061306125130824.62
220804Nowa Wieś Lęborska, gm.900331103110299553117.73
220805Wicko, gm.411810921091103914113.57
  lęborski, pow. 49155 18193 18185 17476 3671 21.01

. . Voting Results for Candidates . .
. .
. . . . . . . . . . .
No. Surname Names No. of votes % No. of votes per candidate/No. per list % No. of votes per candidate/No. of valid votes
1SZCZYPIŃSKA Jolanta Irena98726.885.65
2SELLIN Jarosław Daniel39510.762.26
3BONKOWSKI Waldemar882.390.50
4KOZAK Zbigniew Ryszard1102.990.63
5STANKE Piotr Jerzy621.680.35
6MARKOWSKI Jacek Zygfryd952.580.54
7GASZTA Grzegorz Marek180.490.10
8BARTÓLEWSKA Iwona Barbara501.360.29
9PĘK Tadeusz Szymon87123.724.98
10ANDERS Jadwiga531.440.30
11LEWENSTAM Wojciech Kazimierz180.490.10
12PLESZYNIAK Andrzej100.270.06
13WICZKOWSKI Janusz Piotr691.870.39
14KUŻOWNIK Jan2015.471.15
15RECLAF Witold Grzegorz290.780.17
16KAŹMIERCZAK Andrzej Stanisław270.730.15
17TREDER Adam611.660.35
18KACZYŃSKI Ryszard Paweł3349.091.91
19KRUSZYŃSKI Krzysztof Leon170.460.10
20ORZEŁ Zygmunt350.950.20
21JANUSZEWSKI Zbigniew260.700.15
22GATZ Stanisława Wanda90.240.05
23PROCHOWSKI Dawid Jan80.210.05
24SZULIST Grażyna Irena230.620.13
25BARECKI Marek Andrzej120.320.07
26FURTAK Małgorzata Zofia140.380.08
27UŻAROWSKI Janusz Andrzej120.320.07
28ŁUCZYK Mariusz Wojciech371.000.21
Σ   3671 100.00 21.00
 
. . Voting Results by location of ward electoral commission. . .
. .
. . . . . . . . . . . . .
No. Name No. of entitled
to vote
No. of ballot
papers issued
No. of votes No. of votes: per list / valid [%]
total valid per List
1City30931122741226811805272323.07
2Country1822459195917567194816.72
. Voting Results by number of inhabitants of commune .
1to 5 000325813061306125130824.62
2from 5 001 to 10 000922128092807267641715.58
3from 10 001 to 20 000900331103110299553117.73
4from 20 001 to 50 00027673109681096210554241522.88
5from 50 001 to 100 000000000.00 
6from 100 001 to 200 000000000.00 
7from 200 001 to 500 000000000.00 
8over 500 000000000.00 

  Legal Acts Documents Electoral Bodies Election Committees Turnout Results Statistical Data SENATE PRESIDENT Created by
 top