.
.
Legal Acts
Documents
Electoral Bodies
Election Committees
Turnout
Results
Statistical Data
SENATE
PRESIDENT
Created by
.
.
Voting Results
.
.
.
Voting Results for Committee
.
.
.
.
.
.
.
.
.
.
.
.
.
.
.
.
.
.
.
.
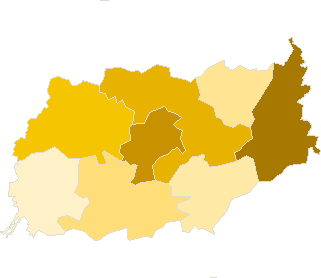
Polska
/
Gdynia
/
kartuski, pow.
...
Komitet Wyborczy Prawo i Sprawiedliwość
List's Number:
6
No. of valid votes:
33760
No. of votes per List:
9422
27.91%
lack
21.39%
22.37%
23.35%
24.33%
25.31%
26.29%
27.27%
28.25%
29.23%
30.21%
not
.
.
.
.
.
.
.
.
.
.
.
.
of data
22.36%
23.34%
24.32%
25.30%
26.28%
27.26%
28.24%
29.22%
30.20%
31.19%
applicable
See also:
Turnout
Votes per Lists
Votes per Candidates
Information about Election Committee
Election results
Voting Results by location of ward electoral commission
.
.
Voting Results for Committee.
.
.
.
.
.
.
.
.
.
.
.
.
.
.
.
.
.
No.
Name
No. of entitled
to vote
No. of ballot papers
issued
No. of votes
No. of votes: per list / valid [%]
total
valid
per List
220501
Chmielno, gm.
4596
2135
2133
2033
611
30.05
220502
Kartuzy, gm.
22994
10803
10795
10366
3017
29.10
220503
Przodkowo, gm.
4805
1984
1979
1890
450
23.81
220504
Sierakowice, gm.
11412
5436
5430
5233
1449
27.69
220505
Somonino, gm.
6341
2623
2622
2545
580
22.79
220506
Stężyca, gm.
6112
2838
2837
2697
663
24.58
220507
Sulęczyno, gm.
3454
1681
1681
1566
335
21.39
220508
Żukowo, gm.
16772
7695
7681
7430
2317
31.18
kartuski, pow.
76486
35195
35158
33760
9422
27.91
.
.
Voting Results for Candidates
.
.
.
.
.
.
.
.
.
.
.
.
.
.
.
No.
Surname Names
No. of votes
% No. of votes per candidate/No. per list
% No. of votes per candidate/No. of valid votes
1
SZCZYPIŃSKA Jolanta Irena
1638
17.38
4.85
2
SELLIN Jarosław Daniel
1528
16.21
4.53
3
BONKOWSKI Waldemar
979
10.39
2.90
4
KOZAK Zbigniew Ryszard
298
3.16
0.88
5
STANKE Piotr Jerzy
321
3.40
0.95
6
MARKOWSKI Jacek Zygfryd
281
2.98
0.83
7
GASZTA Grzegorz Marek
83
0.88
0.25
8
BARTÓLEWSKA Iwona Barbara
114
1.20
0.34
9
PĘK Tadeusz Szymon
408
4.33
1.21
10
ANDERS Jadwiga
126
1.33
0.37
11
LEWENSTAM Wojciech Kazimierz
55
0.58
0.16
12
PLESZYNIAK Andrzej
687
7.29
2.03
13
WICZKOWSKI Janusz Piotr
144
1.52
0.43
14
KUŻOWNIK Jan
39
0.41
0.12
15
RECLAF Witold Grzegorz
178
1.88
0.53
16
KAŹMIERCZAK Andrzej Stanisław
84
0.89
0.25
17
TREDER Adam
174
1.84
0.52
18
KACZYŃSKI Ryszard Paweł
1369
14.52
4.06
19
KRUSZYŃSKI Krzysztof Leon
376
3.99
1.11
20
ORZEŁ Zygmunt
116
1.23
0.34
21
JANUSZEWSKI Zbigniew
43
0.45
0.13
22
GATZ Stanisława Wanda
16
0.16
0.05
23
PROCHOWSKI Dawid Jan
34
0.36
0.10
24
SZULIST Grażyna Irena
113
1.19
0.33
25
BARECKI Marek Andrzej
44
0.46
0.13
26
FURTAK Małgorzata Zofia
78
0.82
0.23
27
UŻAROWSKI Janusz Andrzej
12
0.12
0.04
28
ŁUCZYK Mariusz Wojciech
84
0.89
0.25
Σ
9422
100.00
27.90
.
.
Voting Results by location of ward electoral commission.
.
.
.
.
.
.
.
.
.
.
.
.
.
.
.
.
.
No.
Name
No. of entitled
to vote
No. of ballot
papers issued
No. of votes
No. of votes: per list / valid [%]
total
valid
per List
1
City
17842
8681
8672
8343
2386
28.60
2
Country
58644
26514
26486
25417
7036
27.68
.
Voting Results by number of inhabitants of commune
.
1
to 5 000
3454
1681
1681
1566
335
21.39
2
from 5 001 to 10 000
21854
9580
9571
9165
2304
25.14
3
from 10 001 to 20 000
11412
5436
5430
5233
1449
27.69
4
from 20 001 to 50 000
39766
18498
18476
17796
5334
29.97
5
from 50 001 to 100 000
0
0
0
0
0
0.00
6
from 100 001 to 200 000
0
0
0
0
0
0.00
7
from 200 001 to 500 000
0
0
0
0
0
0.00
8
over 500 000
0
0
0
0
0
0.00
Legal Acts
Documents
Electoral Bodies
Election Committees
Turnout
Results
Statistical Data
SENATE
PRESIDENT
Created by
Copyright [c] 2005
Mikrobit Sp. z o.o.
. All Rights Reserved.
top