.
.
Legal Acts
Documents
Electoral Bodies
Election Committees
Turnout
Results
Statistical Data
SENATE
PRESIDENT
Created by
.
.
Voting Results
.
.
.
Voting Results for Committee
.
.
.
.
.
.
.
.
.
.
.
.
.
.
.
.
.
.
.
.
Polska
/
Opole
/
krapkowicki, pow.
...
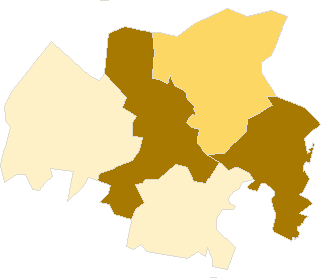
Komitet Wyborczy Prawo i Sprawiedliwość
List's Number:
6
No. of valid votes:
13550
No. of votes per List:
2000
14.76%
lack
5.96%
7.22%
8.48%
9.74%
11.00%
12.26%
13.52%
14.78%
16.04%
17.30%
not
.
.
.
.
.
.
.
.
.
.
.
.
of data
7.21%
8.47%
9.73%
10.99%
12.25%
13.51%
14.77%
16.03%
17.29%
18.56%
applicable
See also:
Turnout
Votes per Lists
Votes per Candidates
Information about Election Committee
Election results
Voting Results by location of ward electoral commission
.
.
Voting Results for Committee.
.
.
.
.
.
.
.
.
.
.
.
.
.
.
.
.
.
No.
Name
No. of entitled
to vote
No. of ballot papers
issued
No. of votes
No. of votes: per list / valid [%]
total
valid
per List
160501
Gogolin, gm.
10058
2378
2377
2244
254
11.32
160502
Krapkowice, gm.
19594
5680
5678
5483
958
17.47
160503
Strzeleczki, gm.
6225
1339
1339
1249
79
6.33
160504
Walce, gm.
4736
1136
1134
1089
65
5.97
160505
Zdzieszowice, gm.
13419
3666
3666
3485
644
18.48
krapkowicki, pow.
54032
14199
14194
13550
2000
14.76
.
.
Voting Results for Candidates
.
.
.
.
.
.
.
.
.
.
.
.
.
.
.
No.
Surname Names
No. of votes
% No. of votes per candidate/No. per list
% No. of votes per candidate/No. of valid votes
1
KŁOSOWSKI Sławomir
529
26.45
3.90
2
CEGLECKA-ZIELONKA Teresa Zuzanna
99
4.95
0.73
3
GUDANIEC Przemysław Andrzej
332
16.60
2.45
4
WALKIEWICZ Mieczysław
34
1.70
0.25
5
STEFAŃSKI Maciej Armin
16
0.80
0.12
6
ŁOWICKA Lidia Natalia
53
2.65
0.39
7
TOMASZEK Bogdan Stanisław
42
2.10
0.31
8
STRONCIWILK Alicja
9
0.45
0.07
9
MADERA Dariusz Piotr
37
1.85
0.27
10
CHABRASZEWSKI Jan
15
0.75
0.11
11
KAŚKÓW Dariusz Adam
19
0.95
0.14
12
KUBACKA Bogumiła
43
2.15
0.32
13
PAWŁOWSKI Wiesław Stanisław
21
1.05
0.15
14
WIEROŃSKA Beata
17
0.85
0.13
15
PIWOWARCZYK Stanisław Ryszard Jerzy
153
7.65
1.13
16
FRASZEK Henryk
13
0.65
0.10
17
KOLBEK Dariusz Stanisław
11
0.55
0.08
18
ŻYŁA Krystyna
34
1.70
0.25
19
MIKRUT Marek Piotr
9
0.45
0.07
20
SZYMAŃSKI Arkadiusz
16
0.80
0.12
21
FEDOROWICZ Beata
24
1.20
0.18
22
WACHOWSKI Dariusz
25
1.25
0.18
23
MUTWIN Roland
15
0.75
0.11
24
KUBÓW Przemysław
2
0.10
0.01
25
KAPKA Wojciech
10
0.50
0.07
26
ROSZKOWIAK Jerzy Marian
422
21.10
3.11
Σ
2000
100.00
14.76
.
.
Voting Results by location of ward electoral commission.
.
.
.
.
.
.
.
.
.
.
.
.
.
.
.
.
.
No.
Name
No. of entitled
to vote
No. of ballot
papers issued
No. of votes
No. of votes: per list / valid [%]
total
valid
per List
1
City
29542
8343
8340
8023
1576
19.64
2
Country
24490
5856
5854
5527
424
7.67
.
Voting Results by number of inhabitants of commune
.
1
to 5 000
0
0
0
0
0
0.00
2
from 5 001 to 10 000
10961
2475
2473
2338
144
6.16
3
from 10 001 to 20 000
23477
6044
6043
5729
898
15.67
4
from 20 001 to 50 000
19594
5680
5678
5483
958
17.47
5
from 50 001 to 100 000
0
0
0
0
0
0.00
6
from 100 001 to 200 000
0
0
0
0
0
0.00
7
from 200 001 to 500 000
0
0
0
0
0
0.00
8
over 500 000
0
0
0
0
0
0.00
Legal Acts
Documents
Electoral Bodies
Election Committees
Turnout
Results
Statistical Data
SENATE
PRESIDENT
Created by
Copyright [c] 2005
Mikrobit Sp. z o.o.
. All Rights Reserved.
top