.
.
Legal Acts
Documents
Electoral Bodies
Election Committees
Turnout
Results
Statistical Data
SENATE
PRESIDENT
Created by
.
.
Voting Results
.
.
.
Voting Results for Committee
.
.
.
.
.
.
.
.
.
.
.
.
.
.
.
.
.
.
.
.
Polska
/
Opole
/
kędzierzyńsko-kozielski, pow.
...
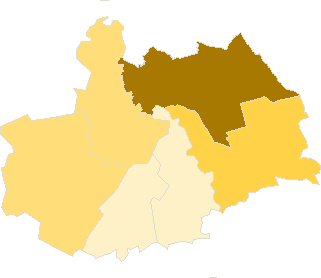
Komitet Wyborczy Prawo i Sprawiedliwość
List's Number:
6
No. of valid votes:
25405
No. of votes per List:
5268
20.74%
lack
8.04%
9.62%
11.20%
12.78%
14.36%
15.94%
17.52%
19.10%
20.68%
22.26%
not
.
.
.
.
.
.
.
.
.
.
.
.
of data
9.61%
11.19%
12.77%
14.35%
15.93%
17.51%
19.09%
20.67%
22.25%
23.84%
applicable
See also:
Turnout
Votes per Lists
Votes per Candidates
Information about Election Committee
Election results
Voting Results by location of ward electoral commission
.
.
Voting Results for Committee.
.
.
.
.
.
.
.
.
.
.
.
.
.
.
.
.
.
No.
Name
No. of entitled
to vote
No. of ballot papers
issued
No. of votes
No. of votes: per list / valid [%]
total
valid
per List
160302
Bierawa, gm.
6279
1651
1651
1553
260
16.74
160303
Cisek, gm.
5089
1329
1328
1256
101
8.04
160301
Kędzierzyn-Koźle, m.
52164
19096
19073
18471
4394
23.79
160304
Pawłowiczki, gm.
6882
1675
1675
1555
199
12.80
160305
Polska Cerekiew, gm.
3812
982
982
917
82
8.94
160306
Reńska Wieś, gm.
6902
1718
1701
1653
232
14.04
kędzierzyńsko-kozielski, pow.
81128
26451
26410
25405
5268
20.74
.
.
Voting Results for Candidates
.
.
.
.
.
.
.
.
.
.
.
.
.
.
.
No.
Surname Names
No. of votes
% No. of votes per candidate/No. per list
% No. of votes per candidate/No. of valid votes
1
KŁOSOWSKI Sławomir
1465
27.80
5.77
2
CEGLECKA-ZIELONKA Teresa Zuzanna
172
3.26
0.68
3
GUDANIEC Przemysław Andrzej
412
7.82
1.62
4
WALKIEWICZ Mieczysław
92
1.74
0.36
5
STEFAŃSKI Maciej Armin
68
1.29
0.27
6
ŁOWICKA Lidia Natalia
134
2.54
0.53
7
TOMASZEK Bogdan Stanisław
906
17.19
3.57
8
STRONCIWILK Alicja
497
9.43
1.96
9
MADERA Dariusz Piotr
48
0.91
0.19
10
CHABRASZEWSKI Jan
36
0.68
0.14
11
KAŚKÓW Dariusz Adam
30
0.56
0.12
12
KUBACKA Bogumiła
120
2.27
0.47
13
PAWŁOWSKI Wiesław Stanisław
69
1.30
0.27
14
WIEROŃSKA Beata
48
0.91
0.19
15
PIWOWARCZYK Stanisław Ryszard Jerzy
52
0.98
0.20
16
FRASZEK Henryk
129
2.44
0.51
17
KOLBEK Dariusz Stanisław
40
0.75
0.16
18
ŻYŁA Krystyna
85
1.61
0.33
19
MIKRUT Marek Piotr
20
0.37
0.08
20
SZYMAŃSKI Arkadiusz
117
2.22
0.46
21
FEDOROWICZ Beata
406
7.70
1.60
22
WACHOWSKI Dariusz
64
1.21
0.25
23
MUTWIN Roland
62
1.17
0.24
24
KUBÓW Przemysław
7
0.13
0.03
25
KAPKA Wojciech
136
2.58
0.54
26
ROSZKOWIAK Jerzy Marian
53
1.00
0.21
Σ
5268
100.00
20.73
.
.
Voting Results by location of ward electoral commission.
.
.
.
.
.
.
.
.
.
.
.
.
.
.
.
.
.
No.
Name
No. of entitled
to vote
No. of ballot
papers issued
No. of votes
No. of votes: per list / valid [%]
total
valid
per List
1
City
52164
19096
19073
18471
4394
23.79
2
Country
28964
7355
7337
6934
874
12.60
.
Voting Results by number of inhabitants of commune
.
1
to 5 000
3812
982
982
917
82
8.94
2
from 5 001 to 10 000
25152
6373
6355
6017
792
13.16
3
from 10 001 to 20 000
0
0
0
0
0
0.00
4
from 20 001 to 50 000
0
0
0
0
0
0.00
5
from 50 001 to 100 000
52164
19096
19073
18471
4394
23.79
6
from 100 001 to 200 000
0
0
0
0
0
0.00
7
from 200 001 to 500 000
0
0
0
0
0
0.00
8
over 500 000
0
0
0
0
0
0.00
Legal Acts
Documents
Electoral Bodies
Election Committees
Turnout
Results
Statistical Data
SENATE
PRESIDENT
Created by
Copyright [c] 2005
Mikrobit Sp. z o.o.
. All Rights Reserved.
top