.
.
Legal Acts
Documents
Electoral Bodies
Election Committees
Turnout
Results
Statistical Data
SENATE
PRESIDENT
Created by
.
.
Voting Results
.
.
.
Voting Results for Committee
.
.
.
.
.
.
.
.
.
.
.
.
.
.
.
.
.
.
.
.
Polska
/
Opole
/
brzeski, pow.
...
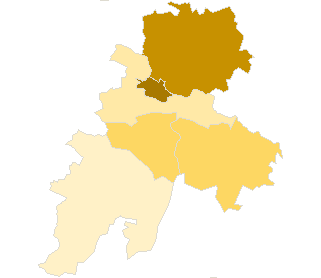
Komitet Wyborczy Prawo i Sprawiedliwość
List's Number:
6
No. of valid votes:
24953
No. of votes per List:
6035
24.19%
lack
17.49%
18.56%
19.63%
20.70%
21.77%
22.84%
23.91%
24.98%
26.05%
27.12%
not
.
.
.
.
.
.
.
.
.
.
.
.
of data
18.55%
19.62%
20.69%
21.76%
22.83%
23.90%
24.97%
26.04%
27.11%
28.19%
applicable
See also:
Turnout
Votes per Lists
Votes per Candidates
Information about Election Committee
Election results
Voting Results by location of ward electoral commission
.
.
Voting Results for Committee.
.
.
.
.
.
.
.
.
.
.
.
.
.
.
.
.
.
No.
Name
No. of entitled
to vote
No. of ballot papers
issued
No. of votes
No. of votes: per list / valid [%]
total
valid
per List
160101
Brzeg, m.
31381
12007
11962
11620
3273
28.17
160103
Grodków, gm.
15566
4953
4953
4772
835
17.50
160104
Lewin Brzeski, gm.
10377
3449
3448
3299
723
21.92
160105
Lubsza, gm.
6820
2235
2235
2142
573
26.75
160106
Olszanka, gm.
3845
1313
1313
1263
275
21.77
160102
Skarbimierz, gm.
5194
1941
1941
1857
356
19.17
brzeski, pow.
73183
25898
25852
24953
6035
24.19
.
.
Voting Results for Candidates
.
.
.
.
.
.
.
.
.
.
.
.
.
.
.
No.
Surname Names
No. of votes
% No. of votes per candidate/No. per list
% No. of votes per candidate/No. of valid votes
1
KŁOSOWSKI Sławomir
2051
33.98
8.22
2
CEGLECKA-ZIELONKA Teresa Zuzanna
383
6.34
1.53
3
GUDANIEC Przemysław Andrzej
207
3.42
0.83
4
WALKIEWICZ Mieczysław
134
2.22
0.54
5
STEFAŃSKI Maciej Armin
1511
25.03
6.06
6
ŁOWICKA Lidia Natalia
176
2.91
0.71
7
TOMASZEK Bogdan Stanisław
162
2.68
0.65
8
STRONCIWILK Alicja
53
0.87
0.21
9
MADERA Dariusz Piotr
73
1.20
0.29
10
CHABRASZEWSKI Jan
36
0.59
0.14
11
KAŚKÓW Dariusz Adam
129
2.13
0.52
12
KUBACKA Bogumiła
121
2.00
0.48
13
PAWŁOWSKI Wiesław Stanisław
98
1.62
0.39
14
WIEROŃSKA Beata
64
1.06
0.26
15
PIWOWARCZYK Stanisław Ryszard Jerzy
140
2.31
0.56
16
FRASZEK Henryk
76
1.25
0.30
17
KOLBEK Dariusz Stanisław
40
0.66
0.16
18
ŻYŁA Krystyna
88
1.45
0.35
19
MIKRUT Marek Piotr
58
0.96
0.23
20
SZYMAŃSKI Arkadiusz
85
1.40
0.34
21
FEDOROWICZ Beata
133
2.20
0.53
22
WACHOWSKI Dariusz
73
1.20
0.29
23
MUTWIN Roland
10
0.16
0.04
24
KUBÓW Przemysław
57
0.94
0.23
25
KAPKA Wojciech
16
0.26
0.06
26
ROSZKOWIAK Jerzy Marian
61
1.01
0.24
Σ
6035
100.00
24.18
.
.
Voting Results by location of ward electoral commission.
.
.
.
.
.
.
.
.
.
.
.
.
.
.
.
.
.
No.
Name
No. of entitled
to vote
No. of ballot
papers issued
No. of votes
No. of votes: per list / valid [%]
total
valid
per List
1
City
44775
16778
16733
16217
4269
26.32
2
Country
28408
9120
9119
8736
1766
20.22
.
Voting Results by number of inhabitants of commune
.
1
to 5 000
3845
1313
1313
1263
275
21.77
2
from 5 001 to 10 000
12014
4176
4176
3999
929
23.23
3
from 10 001 to 20 000
25943
8402
8401
8071
1558
19.30
4
from 20 001 to 50 000
31381
12007
11962
11620
3273
28.17
5
from 50 001 to 100 000
0
0
0
0
0
0.00
6
from 100 001 to 200 000
0
0
0
0
0
0.00
7
from 200 001 to 500 000
0
0
0
0
0
0.00
8
over 500 000
0
0
0
0
0
0.00
Legal Acts
Documents
Electoral Bodies
Election Committees
Turnout
Results
Statistical Data
SENATE
PRESIDENT
Created by
Copyright [c] 2005
Mikrobit Sp. z o.o.
. All Rights Reserved.
top