| . |
. |
Voting Results for Committee |
. |
. |
| . |
. |
| . |
. |
. |
. |
. |
. |
. |
. |
. |
. |
. |
. |
. |
. |
. |
. |
| Polska / Sieradz / zgierski, pow. ... |
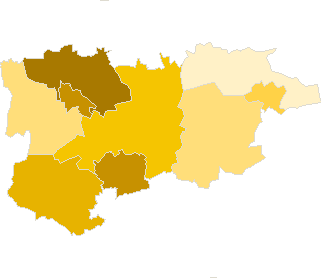 |
| Komitet Wyborczy Prawo i Sprawiedliwość |
| List's Number: |
6 |
| No. of valid votes: |
47172 |
| No. of votes per List: |
12459 |
26.41% |
|
| lack | 7.83% | 10.38% | 12.93% | 15.48% | 18.03% | 20.58% | 23.13% | 25.68% | 28.23% | 30.78% | not | | . | . | . | . | . | . | . | . | . | . | . | . | | of data | 10.37% | 12.92% | 15.47% | 18.02% | 20.57% | 23.12% | 25.67% | 28.22% | 30.77% | 33.33% | applicable |
|
See also:
|
| . |
. |
Voting Results for Committee. |
. |
. |
| . |
. |
| . |
. |
. |
. |
. |
. |
. |
. |
. |
. |
. |
. |
. |
| No. |
Name |
No. of entitled
to vote |
No. of ballot papers
issued |
No. of votes |
No. of votes: per list / valid [%] |
| total |
valid |
per List |
| 102004 | Aleksandrów Łódzki, gm. | 21149 | 7774 | 7761 | 7435 | 1939 | 26.08 |  |
| 102005 | Głowno, gm. | 3900 | 1448 | 1447 | 1404 | 110 | 7.83 | |
| 102001 | Głowno, m. | 12433 | 4352 | 4350 | 4168 | 871 | 20.90 | |
| 102006 | Ozorków, gm. | 5096 | 2188 | 2185 | 2077 | 692 | 33.32 | |
| 102002 | Ozorków, m. | 16915 | 5725 | 5723 | 5449 | 1623 | 29.79 | |
| 102007 | Parzęczew, gm. | 4121 | 1430 | 1430 | 1378 | 246 | 17.85 | |
| 102008 | Stryków, gm. | 9668 | 3287 | 3287 | 3131 | 520 | 16.61 | |
| 102009 | Zgierz, gm. | 8573 | 3417 | 3413 | 3245 | 780 | 24.04 | |
| 102003 | Zgierz, m. | 47856 | 19678 | 19559 | 18885 | 5678 | 30.07 | |
| |
zgierski, pow. |
129711 |
49299 |
49155 |
47172 |
12459 |
26.41 |
 |
|
| |
| . |
. |
Voting Results by location of ward electoral commission. |
. |
. |
| . |
. |
| . |
. |
. |
. |
. |
. |
. |
. |
. |
. |
. |
. |
. |
| No. |
Name |
No. of entitled
to vote |
No. of ballot
papers issued |
No. of votes |
No. of votes: per list / valid [%] |
| total |
valid |
per List |
| 1 | City | 97294 | 37029 | 36896 | 35425 | 10029 | 28.31 | |
| 2 | Country | 32417 | 12270 | 12259 | 11747 | 2430 | 20.69 | |
| . |
Voting Results by number of inhabitants of commune |
. |
| 1 | to 5 000 | 0 | 0 | 0 | 0 | 0 | 0.00 | |
| 2 | from 5 001 to 10 000 | 13117 | 5066 | 5062 | 4859 | 1048 | 21.57 | |
| 3 | from 10 001 to 20 000 | 30674 | 11056 | 11050 | 10544 | 2171 | 20.59 | |
| 4 | from 20 001 to 50 000 | 38064 | 13499 | 13484 | 12884 | 3562 | 27.65 | |
| 5 | from 50 001 to 100 000 | 47856 | 19678 | 19559 | 18885 | 5678 | 30.07 | |
| 6 | from 100 001 to 200 000 | 0 | 0 | 0 | 0 | 0 | 0.00 | |
| 7 | from 200 001 to 500 000 | 0 | 0 | 0 | 0 | 0 | 0.00 | |
| 8 | over 500 000 | 0 | 0 | 0 | 0 | 0 | 0.00 | |
|
|


 Legal Acts
 Legal Acts