| . |
. |
Voting Results for Committee |
. |
. |
| . |
. |
| . |
. |
. |
. |
. |
. |
. |
. |
. |
. |
. |
. |
. |
. |
. |
. |
| Polska / Sieradz / wieluński, pow. ... |
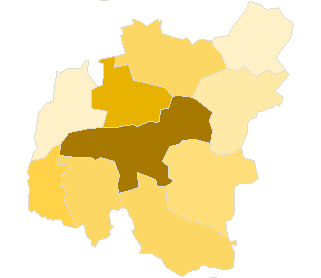 |
| Komitet Wyborczy Prawo i Sprawiedliwość |
| List's Number: |
6 |
| No. of valid votes: |
23992 |
| No. of votes per List: |
3774 |
15.73% |
|
| lack | 8.60% | 9.73% | 10.86% | 11.99% | 13.12% | 14.25% | 15.38% | 16.51% | 17.64% | 18.77% | not | | . | . | . | . | . | . | . | . | . | . | . | . | | of data | 9.72% | 10.85% | 11.98% | 13.11% | 14.24% | 15.37% | 16.50% | 17.63% | 18.76% | 19.90% | applicable |
|
See also:
|
| . |
. |
Voting Results for Committee. |
. |
. |
| . |
. |
| . |
. |
. |
. |
. |
. |
. |
. |
. |
. |
. |
. |
. |
| No. |
Name |
No. of entitled
to vote |
No. of ballot papers
issued |
No. of votes |
No. of votes: per list / valid [%] |
| total |
valid |
per List |
| 101701 | Biała, gm. | 4306 | 1556 | 1555 | 1476 | 127 | 8.60 |  |
| 101702 | Czarnożyły, gm. | 3539 | 1379 | 1377 | 1326 | 219 | 16.52 | |
| 101703 | Konopnica, gm. | 3279 | 1334 | 1334 | 1269 | 112 | 8.83 | |
| 101704 | Mokrsko, gm. | 4254 | 1823 | 1822 | 1705 | 241 | 14.13 | |
| 101705 | Osjaków, gm. | 3692 | 1608 | 1605 | 1511 | 152 | 10.06 | |
| 101706 | Ostrówek, gm. | 3649 | 1347 | 1347 | 1253 | 178 | 14.21 | |
| 101707 | Pątnów, gm. | 4941 | 2477 | 2477 | 2394 | 327 | 13.66 | |
| 101708 | Skomlin, gm. | 2744 | 1145 | 1145 | 1082 | 161 | 14.88 | |
| 101709 | Wieluń, gm. | 27071 | 10810 | 10807 | 10341 | 2048 | 19.80 | |
| 101710 | Wierzchlas, gm. | 5153 | 1735 | 1735 | 1635 | 209 | 12.78 | |
| |
wieluński, pow. |
62628 |
25214 |
25204 |
23992 |
3774 |
15.73 |
 |
|
| |
| . |
. |
Voting Results by location of ward electoral commission. |
. |
. |
| . |
. |
| . |
. |
. |
. |
. |
. |
. |
. |
. |
. |
. |
. |
. |
| No. |
Name |
No. of entitled
to vote |
No. of ballot
papers issued |
No. of votes |
No. of votes: per list / valid [%] |
| total |
valid |
per List |
| 1 | City | 19866 | 8143 | 8142 | 7800 | 1682 | 21.56 | |
| 2 | Country | 42762 | 17071 | 17062 | 16192 | 2092 | 12.92 | |
| . |
Voting Results by number of inhabitants of commune |
. |
| 1 | to 5 000 | 16903 | 6813 | 6808 | 6441 | 822 | 12.76 | |
| 2 | from 5 001 to 10 000 | 18654 | 7591 | 7589 | 7210 | 904 | 12.54 | |
| 3 | from 10 001 to 20 000 | 0 | 0 | 0 | 0 | 0 | 0.00 | |
| 4 | from 20 001 to 50 000 | 27071 | 10810 | 10807 | 10341 | 2048 | 19.80 | |
| 5 | from 50 001 to 100 000 | 0 | 0 | 0 | 0 | 0 | 0.00 | |
| 6 | from 100 001 to 200 000 | 0 | 0 | 0 | 0 | 0 | 0.00 | |
| 7 | from 200 001 to 500 000 | 0 | 0 | 0 | 0 | 0 | 0.00 | |
| 8 | over 500 000 | 0 | 0 | 0 | 0 | 0 | 0.00 | |
|
|


 Legal Acts
 Legal Acts