| . |
. |
Voting Results for Committee |
. |
. |
| . |
. |
| . |
. |
. |
. |
. |
. |
. |
. |
. |
. |
. |
. |
. |
. |
. |
. |
| Polska / Sieradz / sieradzki, pow. ... |
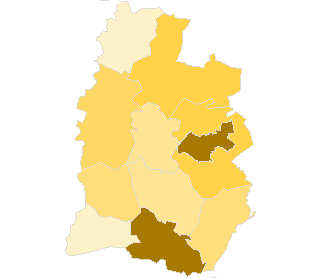 |
| Komitet Wyborczy Prawo i Sprawiedliwość |
| List's Number: |
6 |
| No. of valid votes: |
36408 |
| No. of votes per List: |
6267 |
17.21% |
|
| lack | 6.13% | 7.81% | 9.49% | 11.17% | 12.85% | 14.53% | 16.21% | 17.89% | 19.57% | 21.25% | not | | . | . | . | . | . | . | . | . | . | . | . | . | | of data | 7.80% | 9.48% | 11.16% | 12.84% | 14.52% | 16.20% | 17.88% | 19.56% | 21.24% | 22.93% | applicable |
|
See also:
|
| . |
. |
Voting Results for Committee. |
. |
. |
| . |
. |
| . |
. |
. |
. |
. |
. |
. |
. |
. |
. |
. |
. |
. |
| No. |
Name |
No. of entitled
to vote |
No. of ballot papers
issued |
No. of votes |
No. of votes: per list / valid [%] |
| total |
valid |
per List |
| 101402 | Błaszki, gm. | 11837 | 4085 | 4084 | 3903 | 514 | 13.17 |  |
| 101403 | Brąszewice, gm. | 3326 | 1364 | 1363 | 1287 | 145 | 11.27 | |
| 101404 | Brzeźnio, gm. | 4922 | 1997 | 1996 | 1883 | 198 | 10.52 | |
| 101405 | Burzenin, gm. | 4508 | 1625 | 1624 | 1516 | 177 | 11.68 | |
| 101406 | Goszczanów, gm. | 4487 | 1520 | 1518 | 1451 | 110 | 7.58 | |
| 101407 | Klonowa, gm. | 2384 | 1009 | 1006 | 961 | 59 | 6.14 | |
| 101408 | Sieradz, gm. | 7483 | 2817 | 2815 | 2692 | 412 | 15.30 | |
| 101401 | Sieradz, m. | 37183 | 15919 | 15893 | 15184 | 3472 | 22.87 | |
| 101409 | Warta, gm. | 10709 | 4122 | 4119 | 3873 | 595 | 15.36 | |
| 101410 | Wróblew, gm. | 4940 | 1860 | 1856 | 1788 | 174 | 9.73 | |
| 101411 | Złoczew, gm. | 5756 | 2049 | 2045 | 1870 | 411 | 21.98 | |
| |
sieradzki, pow. |
97535 |
38367 |
38319 |
36408 |
6267 |
17.21 |
 |
|
| |
| . |
. |
Voting Results by location of ward electoral commission. |
. |
. |
| . |
. |
| . |
. |
. |
. |
. |
. |
. |
. |
. |
. |
. |
. |
. |
| No. |
Name |
No. of entitled
to vote |
No. of ballot
papers issued |
No. of votes |
No. of votes: per list / valid [%] |
| total |
valid |
per List |
| 1 | City | 47224 | 19761 | 19729 | 18783 | 4296 | 22.87 | |
| 2 | Country | 50311 | 18606 | 18590 | 17625 | 1971 | 11.18 | |
| . |
Voting Results by number of inhabitants of commune |
. |
| 1 | to 5 000 | 5710 | 2373 | 2369 | 2248 | 204 | 9.07 | |
| 2 | from 5 001 to 10 000 | 32096 | 11868 | 11854 | 11200 | 1482 | 13.23 | |
| 3 | from 10 001 to 20 000 | 22546 | 8207 | 8203 | 7776 | 1109 | 14.26 | |
| 4 | from 20 001 to 50 000 | 37183 | 15919 | 15893 | 15184 | 3472 | 22.87 | |
| 5 | from 50 001 to 100 000 | 0 | 0 | 0 | 0 | 0 | 0.00 | |
| 6 | from 100 001 to 200 000 | 0 | 0 | 0 | 0 | 0 | 0.00 | |
| 7 | from 200 001 to 500 000 | 0 | 0 | 0 | 0 | 0 | 0.00 | |
| 8 | over 500 000 | 0 | 0 | 0 | 0 | 0 | 0.00 | |
|
|


 Legal Acts
 Legal Acts