.
.
 
. .
Voting Results
.
. . Voting Results for Committee . .
. .
. . . . . . . . . . . . . . . .
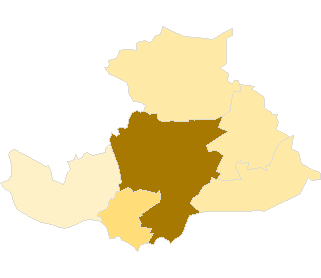
Polska / Lublin / rycki, pow. ...
Komitet Wyborczy Prawo i Sprawiedliwość
List's Number: 6
No. of valid votes: 18899
No. of votes per List: 4329
22.91%
lack12.57%14.70%16.83%18.96%21.09%23.22%25.35%27.48%29.61%31.74%not
............
of data14.69%16.82%18.95%21.08%23.21%25.34%27.47%29.60%31.73%33.87%applicable

See also:
. . Voting Results for Committee. . .
. .
. . . . . . . . . . . . .
No. Name No. of entitled
to vote
No. of ballot papers
issued
No. of votes No. of votes: per list / valid [%]
total valid per List
061601Dęblin, m.14867591559015656112219.84
061602Kłoczew, gm.585024112410228533614.70
061603Nowodwór, gm.329113811381131320115.31
061604Ryki, gm.16785700970056689226233.82
061605Stężyca, gm.447218681863175722112.58
061606Ułęż, gm.290212741273119918715.60
  rycki, pow. 48167 19858 19833 18899 4329 22.91

. . Voting Results for Candidates . .
. .
. . . . . . . . . . .
No. Surname Names No. of votes % No. of votes per candidate/No. per list % No. of votes per candidate/No. of valid votes
1KRUK Elżbieta Małgorzata3407.851.80
2MICHAŁKIEWICZ Krzysztof1403.230.74
3CHRZĄSTOWSKI Andrzej Gierard330.760.17
4SADURSKA Małgorzata Barbara1583.640.84
5SOBOŃ Artur280.640.15
6ŻACZEK Jarosław303370.0616.05
7JAZUREK Bogusław541.240.29
8RZEPECKI Waldemar160.360.08
9WÓJTOWICZ Tomasz410.940.22
10RYL Andrzej390.900.21
11JANKOWSKI Andrzej300.690.16
12BIELECKI Jerzy210.480.11
13NIEDBAŁA Zdzisław Marian130.300.07
14KOPYŚĆ Krzysztof170.390.09
15BOGDAŃSKA Barbara260.600.14
16GAWRYSZCZAK Piotr120.270.06
17KACZYŃSKI Tomasz1423.280.75
18GEMBKA Maria120.270.06
19SZCZĘSNY Marian Stanisław130.300.07
20SADOWSKA-KRAWCZYK Bożenna Jadwiga260.600.14
21KUDELSKA Alicja Maria80.180.04
22SEKUŁA Joanna Maria200.460.11
23BARTOSZEWSKI Marcin Dariusz240.550.13
24JANISZEWSKA Beata Barbara190.430.10
25KUSIAK Stanisław70.160.04
26WINIARSKI Piotr200.460.11
27NIEĆKO Józef10.020.01
28MIZAK Tomasz110.250.06
29STAWIARSKI Jarosław70.160.04
30JAWOR Grzegorz180.410.10
Σ   4329 100.00 22.90
 
. . Voting Results by location of ward electoral commission. . .
. .
. . . . . . . . . . . . .
No. Name No. of entitled
to vote
No. of ballot
papers issued
No. of votes No. of votes: per list / valid [%]
total valid per List
1City23235949894819101228725.13
2Country2493210360103529798204220.84
. Voting Results by number of inhabitants of commune .
1to 5 000619326552654251238815.45
2from 5 001 to 10 0001032242794273404255713.78
3from 10 001 to 20 00014867591559015656112219.84
4from 20 001 to 50 00016785700970056689226233.82
5from 50 001 to 100 000000000.00 
6from 100 001 to 200 000000000.00 
7from 200 001 to 500 000000000.00 
8over 500 000000000.00 

  Legal Acts Documents Electoral Bodies Election Committees Turnout Results Statistical Data SENATE PRESIDENT Created by
 top