| . |
. |
Voting Results for Committee |
. |
. |
| . |
. |
| . |
. |
. |
. |
. |
. |
. |
. |
. |
. |
. |
. |
. |
. |
. |
. |
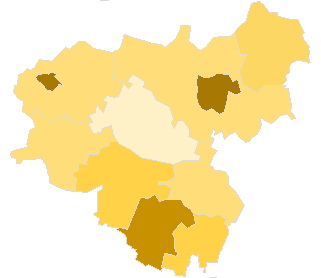
| Polska / Lublin / łukowski, pow. ... |
 |
| Komitet Wyborczy Prawo i Sprawiedliwość |
| List's Number: |
6 |
| No. of valid votes: |
32732 |
| No. of votes per List: |
5472 |
16.72% |
|
| lack | 3.80% | 6.01% | 8.22% | 10.43% | 12.64% | 14.85% | 17.06% | 19.27% | 21.48% | 23.69% | not | | . | . | . | . | . | . | . | . | . | . | . | . | | of data | 6.00% | 8.21% | 10.42% | 12.63% | 14.84% | 17.05% | 19.26% | 21.47% | 23.68% | 25.90% | applicable |
|
See also:
|
| . |
. |
Voting Results for Committee. |
. |
. |
| . |
. |
| . |
. |
. |
. |
. |
. |
. |
. |
. |
. |
. |
. |
. |
| No. |
Name |
No. of entitled
to vote |
No. of ballot papers
issued |
No. of votes |
No. of votes: per list / valid [%] |
| total |
valid |
per List |
| 061103 | Adamów, gm. | 4677 | 1826 | 1825 | 1708 | 369 | 21.60 |  |
| 061104 | Krzywda, gm. | 7860 | 2624 | 2612 | 2463 | 392 | 15.92 | |
| 061105 | Łuków, gm. | 12088 | 4852 | 4849 | 4602 | 532 | 11.56 | |
| 061101 | Łuków, m. | 24516 | 10476 | 10408 | 10106 | 2617 | 25.90 | |
| 061106 | Serokomla, gm. | 3384 | 1114 | 1113 | 1025 | 170 | 16.59 | |
| 061107 | Stanin, gm. | 7462 | 3757 | 3754 | 3627 | 138 | 3.80 | |
| 061108 | Stoczek Łukowski, gm. | 6710 | 2425 | 2425 | 2320 | 275 | 11.85 | |
| 061102 | Stoczek Łukowski, m. | 2134 | 959 | 959 | 871 | 216 | 24.80 | |
| 061109 | Trzebieszów, gm. | 5700 | 2617 | 2617 | 2529 | 367 | 14.51 | |
| 061110 | Wojcieszków, gm. | 5516 | 2108 | 2107 | 1992 | 238 | 11.95 | |
| 061111 | Wola Mysłowska, gm. | 4148 | 1557 | 1556 | 1489 | 158 | 10.61 | |
| |
łukowski, pow. |
84195 |
34315 |
34225 |
32732 |
5472 |
16.72 |
 |
|
| |
| . |
. |
Voting Results by location of ward electoral commission. |
. |
. |
| . |
. |
| . |
. |
. |
. |
. |
. |
. |
. |
. |
. |
. |
. |
. |
| No. |
Name |
No. of entitled
to vote |
No. of ballot
papers issued |
No. of votes |
No. of votes: per list / valid [%] |
| total |
valid |
per List |
| 1 | City | 26650 | 11435 | 11367 | 10977 | 2833 | 25.81 | |
| 2 | Country | 57545 | 22880 | 22858 | 21755 | 2639 | 12.13 | |
| . |
Voting Results by number of inhabitants of commune |
. |
| 1 | to 5 000 | 5518 | 2073 | 2072 | 1896 | 386 | 20.36 | |
| 2 | from 5 001 to 10 000 | 26751 | 10533 | 10530 | 10038 | 1407 | 14.02 | |
| 3 | from 10 001 to 20 000 | 27410 | 11233 | 11215 | 10692 | 1062 | 9.93 | |
| 4 | from 20 001 to 50 000 | 24516 | 10476 | 10408 | 10106 | 2617 | 25.90 | |
| 5 | from 50 001 to 100 000 | 0 | 0 | 0 | 0 | 0 | 0.00 | |
| 6 | from 100 001 to 200 000 | 0 | 0 | 0 | 0 | 0 | 0.00 | |
| 7 | from 200 001 to 500 000 | 0 | 0 | 0 | 0 | 0 | 0.00 | |
| 8 | over 500 000 | 0 | 0 | 0 | 0 | 0 | 0.00 | |
|
|


 Legal Acts
 Legal Acts