.
.
 
. .
Voting Results
.
. . Voting Results for Committee . .
. .
. . . . . . . . . . . . . . . .
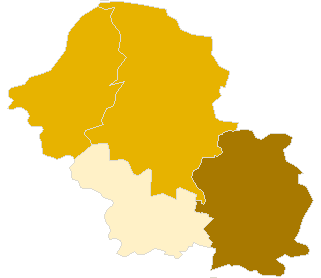
Polska / Wrocław / górowski, pow. ...
Komitet Wyborczy Prawo i Sprawiedliwość
List's Number: 6
No. of valid votes: 8540
No. of votes per List: 1411
16.52%
lack10.15%11.00%11.85%12.70%13.55%14.40%15.25%16.10%16.95%17.80%not
............
of data10.99%11.84%12.69%13.54%14.39%15.24%16.09%16.94%17.79%18.65%applicable

See also:
. . Voting Results for Committee. . .
. .
. . . . . . . . . . . . .
No. Name No. of entitled
to vote
No. of ballot papers
issued
No. of votes No. of votes: per list / valid [%]
total valid per List
020401Góra, gm.1636553855381516585716.59
020402Jemielno, gm.24546676676406510.16
020403Niechlów, gm.391112591259117219816.89
020404Wąsosz, gm.584816641663156329118.62
  górowski, pow. 28578 8975 8970 8540 1411 16.52

. . Voting Results for Candidates . .
. .
. . . . . . . . . . .
No. Surname Names No. of votes % No. of votes per candidate/No. per list % No. of votes per candidate/No. of valid votes
1UJAZDOWSKI Kazimierz Michał45131.965.28
2JACKIEWICZ Dawid Bohdan966.801.12
3NATALLI-ŚWIAT Aleksandra362.550.42
4STOPIŃSKI Grzegorz151.060.18
5HOLANOWSKI Rafał110.770.13
6KEMPA Beata Agnieszka412.900.48
7SZYDŁOWSKI Janusz Józef171.200.20
8WOJEWÓDKA Mariusz Rafał90.630.11
9KILIAN Wiesław20114.242.35
10KRZYŻANIAK Marek292.050.34
11MROZOWSKA Urszula191.340.22
12NEJMAN Maciej Feliks130.920.15
13BUŁAJEWSKI Ireneusz50.350.06
14GRZELIŃSKA Grażyna Maria151.060.18
15ŻARA Tomasz90.630.11
16CUKROWSKI Marek Jan20.140.02
17DĄBROWSKI Andrzej Mieczysław161.130.19
18ZAWARTKO Maria Dorota60.420.07
19ZAGROBELNY Marek32222.823.77
20KOBEL Mirosław Czesław30.210.04
21ONUFER Mariusz40.280.05
22LISOWSKI Mirosław Stanisław161.130.19
23MITKIEWICZ Wiesław60.420.07
24GRACZYK Tadeusz Waldemar20.140.02
25SIEWIERA Jacek50.350.06
26MAJCHER Grzegorz110.770.13
27KOPACZ Bartosz171.200.20
28STACHOWIAK RÓŻECKA Mirosława Agnieszka342.400.40
Σ   1411 100.00 16.52
 
. . Voting Results by location of ward electoral commission. . .
. .
. . . . . . . . . . . . .
No. Name No. of entitled
to vote
No. of ballot
papers issued
No. of votes No. of votes: per list / valid [%]
total valid per List
1City1430547594754455287119.13
2Country1427342164216398854013.54
. Voting Results by number of inhabitants of commune .
1to 5 00024546676676406510.16
2from 5 001 to 10 000975929232922273548917.88
3from 10 001 to 20 000000000.00 
4from 20 001 to 50 0001636553855381516585716.59
5from 50 001 to 100 000000000.00 
6from 100 001 to 200 000000000.00 
7from 200 001 to 500 000000000.00 
8over 500 000000000.00 

  Legal Acts Documents Electoral Bodies Election Committees Turnout Results Statistical Data SENATE PRESIDENT Created by
 top