.
.
Legal Acts
Documents
Electoral Bodies
Election Committees
Turnout
Results
Statistical Data
SENATE
PRESIDENT
Created by
.
.
Voting Results
.
.
.
Voting Results for Committee
.
.
.
.
.
.
.
.
.
.
.
.
.
.
.
.
.
.
.
.
Polska
/
Szczecin
/
myśliborski, pow.
...
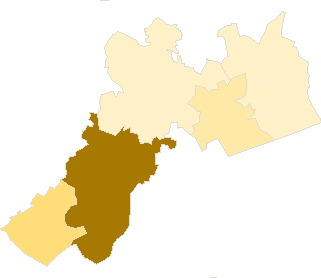
Komitet Wyborczy Liga Polskich Rodzin
List's Number:
3
No. of valid votes:
16250
No. of votes per List:
1422
8.75%
lack
6.80%
7.35%
7.90%
8.45%
9.00%
9.55%
10.10%
10.65%
11.20%
11.75%
not
.
.
.
.
.
.
.
.
.
.
.
.
of data
7.34%
7.89%
8.44%
8.99%
9.54%
10.09%
10.64%
11.19%
11.74%
12.30%
applicable
See also:
Turnout
Votes per Lists
Votes per Candidates
Information about Election Committee
Election results
Voting Results by location of ward electoral commission
.
.
Voting Results for Committee.
.
.
.
.
.
.
.
.
.
.
.
.
.
.
.
.
.
No.
Name
No. of entitled
to vote
No. of ballot papers
issued
No. of votes
No. of votes: per list / valid [%]
total
valid
per List
321001
Barlinek, gm.
15626
5101
5101
4950
337
6.81
321002
Boleszkowice, gm.
2225
565
565
540
46
8.52
321003
Dębno, gm.
16321
5364
5353
5164
634
12.28
321004
Myślibórz, gm.
16814
5182
5176
4977
359
7.21
321005
Nowogródek Pomorski, gm.
2517
654
654
619
46
7.43
myśliborski, pow.
53503
16866
16849
16250
1422
8.75
.
.
Voting Results for Candidates
.
.
.
.
.
.
.
.
.
.
.
.
.
.
.
No.
Surname Names
No. of votes
% No. of votes per candidate/No. per list
% No. of votes per candidate/No. of valid votes
1
WIECHECKI Rafał
206
14.48
1.27
2
KUBIŃSKA-SIERADZKA Renata Magdalena
186
13.08
1.14
3
LEWANDOWSKI Józef Romuald
106
7.45
0.65
4
DRAB Mirosław Jerzy
318
22.36
1.96
5
PODGÓRSKI Paweł Grzegorz
29
2.03
0.18
6
JELEŃ Krzysztof
23
1.61
0.14
7
GAWROŃSKI Błażej
22
1.54
0.14
8
ARDZIŃSKI Andrzej
9
0.63
0.06
9
ROŻYŃSKI Zenon Ryszard
15
1.05
0.09
10
ADAMIAK Krzysztof Radosław
41
2.88
0.25
11
KOMOROWSKI Krzysztof
183
12.86
1.13
12
RÓŻYCKI Zbigniew
23
1.61
0.14
13
KOPA Andrzej
14
0.98
0.09
14
MOŻDŻEŃ Andrzej
11
0.77
0.07
15
MARCINÓW Mirosław
20
1.40
0.12
16
KĘDZIERSKI Janusz Marek
21
1.47
0.13
17
BOHDANIEC Wacław
10
0.70
0.06
18
GRZEBIENIAK Grzegorz Marcin
4
0.28
0.02
19
KOWALSKI Karol Gracjan
12
0.84
0.07
20
FRYSZKOWSKI Ireneusz
5
0.35
0.03
21
ŁUCZAK Wojciech Artur
28
1.96
0.17
22
WIJATKOWSKI Włodzimierz
69
4.85
0.42
23
KOBYŁKO Monika Elżbieta
33
2.32
0.20
24
BUDNIAK Marek
7
0.49
0.04
25
JAROSIŃSKI Przemysław Marcin
13
0.91
0.08
26
MATURA Jakub Jan
14
0.98
0.09
Σ
1422
100.00
8.75
.
.
Voting Results by location of ward electoral commission.
.
.
.
.
.
.
.
.
.
.
.
.
.
.
.
.
.
No.
Name
No. of entitled
to vote
No. of ballot
papers issued
No. of votes
No. of votes: per list / valid [%]
total
valid
per List
1
City
33149
11615
11609
11244
930
8.27
2
Country
20354
5251
5240
5006
492
9.83
.
Voting Results by number of inhabitants of commune
.
1
to 5 000
4742
1219
1219
1159
92
7.94
2
from 5 001 to 10 000
0
0
0
0
0
0.00
3
from 10 001 to 20 000
15626
5101
5101
4950
337
6.81
4
from 20 001 to 50 000
33135
10546
10529
10141
993
9.79
5
from 50 001 to 100 000
0
0
0
0
0
0.00
6
from 100 001 to 200 000
0
0
0
0
0
0.00
7
from 200 001 to 500 000
0
0
0
0
0
0.00
8
over 500 000
0
0
0
0
0
0.00
Legal Acts
Documents
Electoral Bodies
Election Committees
Turnout
Results
Statistical Data
SENATE
PRESIDENT
Created by
Copyright [c] 2005
Mikrobit Sp. z o.o.
. All Rights Reserved.
top