.
.
Legal Acts
Documents
Electoral Bodies
Election Committees
Turnout
Results
Statistical Data
SENATE
PRESIDENT
Created by
.
.
Voting Results
.
.
.
Voting Results for Committee
.
.
.
.
.
.
.
.
.
.
.
.
.
.
.
.
.
.
.
.
Polska
/
Kielce
/
skarżyski, pow.
...
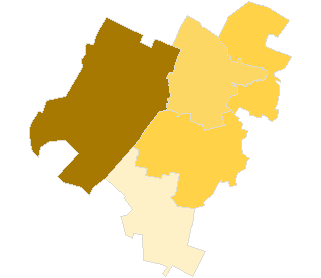
Komitet Wyborczy Liga Polskich Rodzin
List's Number:
3
No. of valid votes:
25015
No. of votes per List:
1709
6.83%
lack
4.08%
4.62%
5.16%
5.70%
6.24%
6.78%
7.32%
7.86%
8.40%
8.94%
not
.
.
.
.
.
.
.
.
.
.
.
.
of data
4.61%
5.15%
5.69%
6.23%
6.77%
7.31%
7.85%
8.39%
8.93%
9.48%
applicable
See also:
Turnout
Votes per Lists
Votes per Candidates
Information about Election Committee
Election results
Voting Results by location of ward electoral commission
.
.
Voting Results for Committee.
.
.
.
.
.
.
.
.
.
.
.
.
.
.
.
.
.
No.
Name
No. of entitled
to vote
No. of ballot papers
issued
No. of votes
No. of votes: per list / valid [%]
total
valid
per List
261002
Bliżyn, gm.
7042
2187
2185
2091
198
9.47
261003
Łączna, gm.
4113
1763
1763
1688
69
4.09
261004
Skarżysko Kościelne, gm.
5099
2082
2082
1958
136
6.95
261001
Skarżysko-Kamienna, m.
42409
16781
16761
16167
1091
6.75
261005
Suchedniów, gm.
9029
3219
3216
3111
215
6.91
skarżyski, pow.
67692
26032
26007
25015
1709
6.83
.
.
Voting Results for Candidates
.
.
.
.
.
.
.
.
.
.
.
.
.
.
.
No.
Surname Names
No. of votes
% No. of votes per candidate/No. per list
% No. of votes per candidate/No. of valid votes
1
PARDA Radosław
612
35.81
2.45
2
HAYDUKIEWICZ Lech Stanisław
64
3.74
0.26
3
MRUSZCZAK Gabriela Maria
78
4.56
0.31
4
JÓZEFOWSKI Kamil Krzysztof
27
1.57
0.11
5
DOMERACKI Jan
27
1.57
0.11
6
ZAJĄC Edmund Józef
41
2.39
0.16
7
ZWIERZYK Krzysztof
14
0.81
0.06
8
WOSIK Sławomir
18
1.05
0.07
9
SUŁEK Krzysztof Andrzej
326
19.07
1.30
10
DOROBEK Grzegorz
29
1.69
0.12
11
NADBRZESKI Rafał
7
0.40
0.03
12
CISZEK Mariusz
28
1.63
0.11
13
SOBIERAJSKI Piotr Andrzej
28
1.63
0.11
14
PORĘBSKI Marian Roman
17
0.99
0.07
15
STAŃCZYK Jerzy Rajmund
10
0.58
0.04
16
STEMPLEWSKI Krzysztof
18
1.05
0.07
17
JASIŃSKI Leon
60
3.51
0.24
18
BIŃCZYK Kamil
63
3.68
0.25
19
KARCZ Paweł
12
0.70
0.05
20
KAMIŃSKI Kacper
10
0.58
0.04
21
SALATA Marzena
37
2.16
0.15
22
PAŁKA Anna Ewa
37
2.16
0.15
23
SADY Aleksandra Agnieszka
17
0.99
0.07
24
WIECH Dariusz Zbigniew
9
0.52
0.04
25
GOLEŃ Grzegorz Paweł
6
0.35
0.02
26
SUDOŁ Tomasz
7
0.40
0.03
27
STĘPNIK Sylwester Andrzej
16
0.93
0.06
28
WĘS Mirosław
6
0.35
0.02
29
CZARNOTA Jakub Daniel
14
0.81
0.06
30
DOROSZ Andrzej Piotr
9
0.52
0.04
31
ZAGÓRSKI Kamil Łukasz
34
1.98
0.14
32
SZCZEPANIAK Robert
28
1.63
0.11
Σ
1709
100.00
6.83
.
.
Voting Results by location of ward electoral commission.
.
.
.
.
.
.
.
.
.
.
.
.
.
.
.
.
.
No.
Name
No. of entitled
to vote
No. of ballot
papers issued
No. of votes
No. of votes: per list / valid [%]
total
valid
per List
1
City
49864
19494
19471
18794
1244
6.62
2
Country
17828
6538
6536
6221
465
7.47
.
Voting Results by number of inhabitants of commune
.
1
to 5 000
0
0
0
0
0
0.00
2
from 5 001 to 10 000
16254
6032
6030
5737
403
7.02
3
from 10 001 to 20 000
9029
3219
3216
3111
215
6.91
4
from 20 001 to 50 000
0
0
0
0
0
0.00
5
from 50 001 to 100 000
42409
16781
16761
16167
1091
6.75
6
from 100 001 to 200 000
0
0
0
0
0
0.00
7
from 200 001 to 500 000
0
0
0
0
0
0.00
8
over 500 000
0
0
0
0
0
0.00
Legal Acts
Documents
Electoral Bodies
Election Committees
Turnout
Results
Statistical Data
SENATE
PRESIDENT
Created by
Copyright [c] 2005
Mikrobit Sp. z o.o.
. All Rights Reserved.
top