| . |
. |
Voting Results for Committee |
. |
. |
| . |
. |
| . |
. |
. |
. |
. |
. |
. |
. |
. |
. |
. |
. |
. |
. |
. |
. |
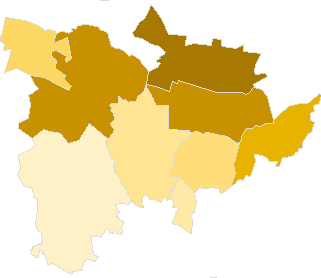
| Polska / Gliwice / tarnogórski, pow. ... |
 |
| Komitet Wyborczy Liga Polskich Rodzin |
| List's Number: |
3 |
| No. of valid votes: |
42820 |
| No. of votes per List: |
2740 |
6.40% |
|
| lack | 5.17% | 5.50% | 5.83% | 6.16% | 6.49% | 6.82% | 7.15% | 7.48% | 7.81% | 8.14% | not | | . | . | . | . | . | . | . | . | . | . | . | . | | of data | 5.49% | 5.82% | 6.15% | 6.48% | 6.81% | 7.14% | 7.47% | 7.80% | 8.13% | 8.47% | applicable |
|
See also:
|
| . |
. |
Voting Results for Committee. |
. |
. |
| . |
. |
| . |
. |
. |
. |
. |
. |
. |
. |
. |
. |
. |
. |
. |
| No. |
Name |
No. of entitled
to vote |
No. of ballot papers
issued |
No. of votes |
No. of votes: per list / valid [%] |
| total |
valid |
per List |
| 241301 | Kalety, m. | 7049 | 2765 | 2765 | 2680 | 225 | 8.40 |  |
| 241305 | Krupski Młyn, gm. | 2740 | 1114 | 1114 | 1079 | 72 | 6.67 | |
| 241302 | Miasteczko Śląskie, m. | 5918 | 2178 | 2150 | 2094 | 170 | 8.12 | |
| 241306 | Ożarowice, gm. | 4309 | 1558 | 1558 | 1500 | 113 | 7.53 | |
| 241303 | Radzionków, m. | 13812 | 6067 | 6047 | 5886 | 328 | 5.57 | |
| 241307 | Świerklaniec, gm. | 8736 | 3449 | 3424 | 3301 | 208 | 6.30 | |
| 241304 | Tarnowskie Góry, m. | 51061 | 21563 | 21553 | 20901 | 1287 | 6.16 | |
| 241308 | Tworóg, gm. | 6437 | 2120 | 2108 | 2036 | 164 | 8.06 | |
| 241309 | Zbrosławice, gm. | 12396 | 3546 | 3546 | 3343 | 173 | 5.17 | |
| |
tarnogórski, pow. |
112458 |
44360 |
44265 |
42820 |
2740 |
6.40 |
 |
|
| |
| . |
. |
Voting Results by location of ward electoral commission. |
. |
. |
| . |
. |
| . |
. |
. |
. |
. |
. |
. |
. |
. |
. |
. |
. |
. |
| No. |
Name |
No. of entitled
to vote |
No. of ballot
papers issued |
No. of votes |
No. of votes: per list / valid [%] |
| total |
valid |
per List |
| 1 | City | 77840 | 32573 | 32515 | 31561 | 2010 | 6.37 | |
| 2 | Country | 34618 | 11787 | 11750 | 11259 | 730 | 6.48 | |
| . |
Voting Results by number of inhabitants of commune |
. |
| 1 | to 5 000 | 2740 | 1114 | 1114 | 1079 | 72 | 6.67 | |
| 2 | from 5 001 to 10 000 | 23713 | 8621 | 8581 | 8310 | 672 | 8.09 | |
| 3 | from 10 001 to 20 000 | 34944 | 13062 | 13017 | 12530 | 709 | 5.66 | |
| 4 | from 20 001 to 50 000 | 0 | 0 | 0 | 0 | 0 | 0.00 | |
| 5 | from 50 001 to 100 000 | 51061 | 21563 | 21553 | 20901 | 1287 | 6.16 | |
| 6 | from 100 001 to 200 000 | 0 | 0 | 0 | 0 | 0 | 0.00 | |
| 7 | from 200 001 to 500 000 | 0 | 0 | 0 | 0 | 0 | 0.00 | |
| 8 | over 500 000 | 0 | 0 | 0 | 0 | 0 | 0.00 | |
|
|


 Legal Acts
 Legal Acts