.
.
Legal Acts
Documents
Electoral Bodies
Election Committees
Turnout
Results
Statistical Data
SENATE
PRESIDENT
Created by
.
.
Voting Results
.
.
.
Voting Results for Committee
.
.
.
.
.
.
.
.
.
.
.
.
.
.
.
.
.
.
.
.
Polska
/
Rzeszów
/
dębicki, pow.
...
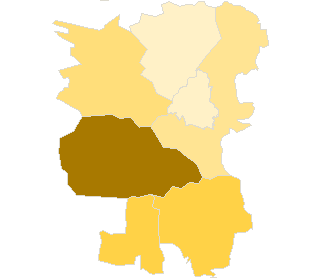
Komitet Wyborczy Liga Polskich Rodzin
List's Number:
3
No. of valid votes:
42410
No. of votes per List:
5330
12.57%
lack
9.49%
10.66%
11.83%
13.00%
14.17%
15.34%
16.51%
17.68%
18.85%
20.02%
not
.
.
.
.
.
.
.
.
.
.
.
.
of data
10.65%
11.82%
12.99%
14.16%
15.33%
16.50%
17.67%
18.84%
20.01%
21.19%
applicable
See also:
Turnout
Votes per Lists
Votes per Candidates
Information about Election Committee
Election results
Voting Results by location of ward electoral commission
.
.
Voting Results for Committee.
.
.
.
.
.
.
.
.
.
.
.
.
.
.
.
.
.
No.
Name
No. of entitled
to vote
No. of ballot papers
issued
No. of votes
No. of votes: per list / valid [%]
total
valid
per List
180302
Brzostek, gm.
9716
3567
3561
3397
533
15.69
180303
Czarna, gm.
9345
3918
3906
3725
502
13.48
180304
Dębica, gm.
17911
7658
7651
7373
900
12.21
180301
Dębica, m.
38052
17838
17789
17291
1642
9.50
180305
Jodłowa, gm.
4158
1161
1156
1088
178
16.36
180306
Pilzno, gm.
12930
5644
5643
5367
1136
21.17
180307
Żyraków, gm.
9921
4299
4296
4169
439
10.53
dębicki, pow.
102033
44085
44002
42410
5330
12.57
.
.
Voting Results for Candidates
.
.
.
.
.
.
.
.
.
.
.
.
.
.
.
No.
Surname Names
No. of votes
% No. of votes per candidate/No. per list
% No. of votes per candidate/No. of valid votes
1
WRZODAK Zygmunt
2451
45.98
5.78
2
MURIAS Halina
141
2.64
0.33
3
ROMANIUK Bogdan Piotr
102
1.91
0.24
4
KRAWIEC Norbert Krzysztof
82
1.53
0.19
5
WĄSIK Stanisław
1213
22.75
2.86
6
KACZKOWSKI Bogusław Ludwik
89
1.66
0.21
7
TOFILSKI Bogusław Władysław
95
1.78
0.22
8
SZYPUŁA Andrzej
66
1.23
0.16
9
PIĄTEK Józef Michał
56
1.05
0.13
10
POSŁUSZNY Jarosław Jan
363
6.81
0.86
11
MICHALSKI Witold Zbigniew
54
1.01
0.13
12
KOLASA Marian
35
0.65
0.08
13
CZUBAT Krzysztof
26
0.48
0.06
14
NIEZGODA Aleksandra Zofia
64
1.20
0.15
15
SZOSTEK Alfred
54
1.01
0.13
16
TYZA Marek
13
0.24
0.03
17
FUS Jan
33
0.61
0.08
18
MAŃKO Zbigniew
14
0.26
0.03
19
STACHOWICZ Augustyn Władysław
17
0.31
0.04
20
OSTROWSKA Ewelina Monika
54
1.01
0.13
21
RUCHAJ Piotr
28
0.52
0.07
22
LĘCZNAR Bogusław Jan
23
0.43
0.05
23
KOZEK Marian
16
0.30
0.04
24
PUTERLA Agnieszka
27
0.50
0.06
25
DRZAŁ Bogumił
23
0.43
0.05
26
NOWACKI Janusz Bogdan
45
0.84
0.11
27
BYTNAR Antoni Władysław
7
0.13
0.02
28
STAWIARSKI Marcin Antoni
8
0.15
0.02
29
KULA Jan
131
2.45
0.31
Σ
5330
100.00
12.56
.
.
Voting Results by location of ward electoral commission.
.
.
.
.
.
.
.
.
.
.
.
.
.
.
.
.
.
No.
Name
No. of entitled
to vote
No. of ballot
papers issued
No. of votes
No. of votes: per list / valid [%]
total
valid
per List
1
City
41485
19484
19435
18877
1933
10.24
2
Country
60548
24601
24567
23533
3397
14.44
.
Voting Results by number of inhabitants of commune
.
1
to 5 000
0
0
0
0
0
0.00
2
from 5 001 to 10 000
4158
1161
1156
1088
178
16.36
3
from 10 001 to 20 000
41912
17428
17406
16658
2610
15.67
4
from 20 001 to 50 000
55963
25496
25440
24664
2542
10.31
5
from 50 001 to 100 000
0
0
0
0
0
0.00
6
from 100 001 to 200 000
0
0
0
0
0
0.00
7
from 200 001 to 500 000
0
0
0
0
0
0.00
8
over 500 000
0
0
0
0
0
0.00
Legal Acts
Documents
Electoral Bodies
Election Committees
Turnout
Results
Statistical Data
SENATE
PRESIDENT
Created by
Copyright [c] 2005
Mikrobit Sp. z o.o.
. All Rights Reserved.
top