.
.
Legal Acts
Documents
Electoral Bodies
Election Committees
Turnout
Results
Statistical Data
SENATE
PRESIDENT
Created by
.
.
Voting Results
.
.
.
Voting Results for Committee
.
.
.
.
.
.
.
.
.
.
.
.
.
.
.
.
.
.
.
.
Polska
/
Lublin
/
świdnicki, pow.
...
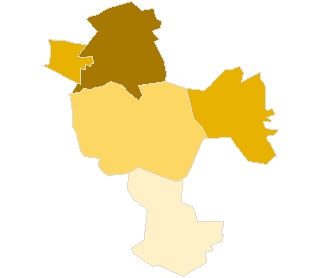
Komitet Wyborczy Liga Polskich Rodzin
List's Number:
3
No. of valid votes:
22024
No. of votes per List:
3285
14.92%
lack
6.45%
7.61%
8.77%
9.93%
11.09%
12.25%
13.41%
14.57%
15.73%
16.89%
not
.
.
.
.
.
.
.
.
.
.
.
.
of data
7.60%
8.76%
9.92%
11.08%
12.24%
13.40%
14.56%
15.72%
16.88%
18.05%
applicable
See also:
Turnout
Votes per Lists
Votes per Candidates
Information about Election Committee
Election results
Voting Results by location of ward electoral commission
.
.
Voting Results for Committee.
.
.
.
.
.
.
.
.
.
.
.
.
.
.
.
.
.
No.
Name
No. of entitled
to vote
No. of ballot papers
issued
No. of votes
No. of votes: per list / valid [%]
total
valid
per List
061702
Mełgiew, gm.
6186
2251
2251
2179
392
17.99
061703
Piaski, gm.
8513
2769
2768
2684
323
12.03
061704
Rybczewice, gm.
3281
1247
1247
1162
75
6.45
061701
Świdnik, m.
33209
14431
14415
14053
2195
15.62
061705
Trawniki, gm.
7264
2074
2074
1946
300
15.42
świdnicki, pow.
58453
22772
22755
22024
3285
14.92
.
.
Voting Results for Candidates
.
.
.
.
.
.
.
.
.
.
.
.
.
.
.
No.
Surname Names
No. of votes
% No. of votes per candidate/No. per list
% No. of votes per candidate/No. of valid votes
1
MAŃKA Andrzej
1935
58.90
8.79
2
MASŁOWSKA Gabriela
541
16.46
2.46
3
KOZŁOWSKI Krzysztof
58
1.76
0.26
4
WAWERSKI Janusz
24
0.73
0.11
5
GRUSZCZYK Józef Krzysztof
23
0.70
0.10
6
MISZCZUK Tomasz Piotr
60
1.82
0.27
7
JAŚKOWSKA Anna
37
1.12
0.17
8
GŁUCHOWSKI Krzysztof
13
0.39
0.06
9
TRUSKOWSKI Marian
17
0.51
0.08
10
SZOŁUCHA Marian
77
2.34
0.35
11
NADZIEJKO Danuta Maria
16
0.48
0.07
12
ROBAK Adam Antoni
16
0.48
0.07
13
WYSOKIŃSKI Władysław
13
0.39
0.06
14
KLOC Czesław
30
0.91
0.14
15
POŻOGA Robert
4
0.12
0.02
16
MITRUCZUK Andrzej Konrad
5
0.15
0.02
17
NADULSKI Roman
4
0.12
0.02
18
DUER Stanisław
20
0.60
0.09
19
CHMIELEWSKA Lucyna
32
0.97
0.15
20
SELWA Zygmunt Stanisław
33
1.00
0.15
21
ZDUNEK Grzegorz Jerzy
8
0.24
0.04
22
MILEWSKI Ryszard Witold
11
0.33
0.05
23
SMYK Krzysztof
162
4.93
0.74
24
KIJEWSKA Renata
19
0.57
0.09
25
KANIA Waldemar Franciszek
6
0.18
0.03
26
MAJ Tomasz
12
0.36
0.05
27
TOMASIAK Jacek Mikołaj
60
1.82
0.27
28
KUSZ Jacek
3
0.09
0.01
29
GREGOROWICZ Leszek
8
0.24
0.04
30
CHRZONSTOWSKI Antoni
38
1.15
0.17
Σ
3285
100.00
14.91
.
.
Voting Results by location of ward electoral commission.
.
.
.
.
.
.
.
.
.
.
.
.
.
.
.
.
.
No.
Name
No. of entitled
to vote
No. of ballot
papers issued
No. of votes
No. of votes: per list / valid [%]
total
valid
per List
1
City
35349
15279
15263
14867
2327
15.65
2
Country
23104
7493
7492
7157
958
13.39
.
Voting Results by number of inhabitants of commune
.
1
to 5 000
3281
1247
1247
1162
75
6.45
2
from 5 001 to 10 000
13450
4325
4325
4125
692
16.78
3
from 10 001 to 20 000
8513
2769
2768
2684
323
12.03
4
from 20 001 to 50 000
33209
14431
14415
14053
2195
15.62
5
from 50 001 to 100 000
0
0
0
0
0
0.00
6
from 100 001 to 200 000
0
0
0
0
0
0.00
7
from 200 001 to 500 000
0
0
0
0
0
0.00
8
over 500 000
0
0
0
0
0
0.00
Legal Acts
Documents
Electoral Bodies
Election Committees
Turnout
Results
Statistical Data
SENATE
PRESIDENT
Created by
Copyright [c] 2005
Mikrobit Sp. z o.o.
. All Rights Reserved.
top