.
.
Legal Acts
Documents
Electoral Bodies
Election Committees
Turnout
Results
Statistical Data
SENATE
PRESIDENT
Created by
.
.
Voting Results
.
.
.
Voting Results for Committee
.
.
.
.
.
.
.
.
.
.
.
.
.
.
.
.
.
.
.
.
Polska
/
Toruń
/
grudziądzki, pow.
...
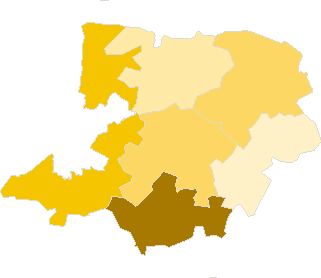
Komitet Wyborczy Liga Polskich Rodzin
List's Number:
3
No. of valid votes:
8617
No. of votes per List:
675
7.83%
lack
4.82%
5.43%
6.04%
6.65%
7.26%
7.87%
8.48%
9.09%
9.70%
10.31%
not
.
.
.
.
.
.
.
.
.
.
.
.
of data
5.42%
6.03%
6.64%
7.25%
7.86%
8.47%
9.08%
9.69%
10.30%
10.92%
applicable
See also:
Turnout
Votes per Lists
Votes per Candidates
Information about Election Committee
Election results
Voting Results by location of ward electoral commission
.
.
Voting Results for Committee.
.
.
.
.
.
.
.
.
.
.
.
.
.
.
.
.
.
No.
Name
No. of entitled
to vote
No. of ballot papers
issued
No. of votes
No. of votes: per list / valid [%]
total
valid
per List
040601
Grudziądz, gm.
7913
2336
2336
2236
190
8.50
040602
Gruta, gm.
5080
1510
1510
1459
114
7.81
040603
Łasin, gm.
6544
2135
2120
2011
156
7.76
040604
Radzyń Chełmiński, gm.
3719
1198
1198
1135
123
10.84
040605
Rogóźno, gm.
3106
884
875
843
47
5.58
040606
Świecie nad Osą, gm.
3412
984
985
933
45
4.82
grudziądzki, pow.
29774
9047
9024
8617
675
7.83
.
.
Voting Results for Candidates
.
.
.
.
.
.
.
.
.
.
.
.
.
.
.
No.
Surname Names
No. of votes
% No. of votes per candidate/No. per list
% No. of votes per candidate/No. of valid votes
1
SOBECKA Anna Elżbieta
386
57.18
4.48
2
WAŁĘSA Dariusz Stanisław
39
5.77
0.45
3
TRAWIŃSKI Marek Piotr
11
1.62
0.13
4
TUPTYŃSKA Barbara Maria
24
3.55
0.28
5
ZDROJEWSKI Lech Jan
18
2.66
0.21
6
SUGALSKI Zbigniew Wiesław
6
0.88
0.07
7
BANACHOWICZ Bożena Stanisława
12
1.77
0.14
8
WOSZCZYŃSKA Jadwiga Genowefa
10
1.48
0.12
9
SŁAWIŃSKI Wojciech
8
1.18
0.09
10
PÓŁTORAK Roman
4
0.59
0.05
11
BERENT Marek
8
1.18
0.09
12
POBÓG-RUSZKOWSKI Andrzej Edmund
13
1.92
0.15
13
SZCZEPANIK Henryk Jan
76
11.25
0.88
14
JANKOWSKI Jacek
14
2.07
0.16
15
SKRAJNY Marcin Arkadiusz
2
0.29
0.02
16
GÓRALSKI Jerzy Melchior
2
0.29
0.02
17
ZIELIŃSKI Mirosław
12
1.77
0.14
18
ZAPARUSZEWSKI Tadeusz
3
0.44
0.03
19
BŁASZCZYK Krzysztof Robert
2
0.29
0.02
20
STRZAŁKOWSKI Karol
2
0.29
0.02
21
MAŁKIEWICZ Łukasz
2
0.29
0.02
22
KAPROŃ Bartłomiej Kazimierz
2
0.29
0.02
23
TARKA Mirosław Paweł
5
0.74
0.06
24
LUTOWSKI Piotr Longin
1
0.14
0.01
25
MISZTAL Jacek Piotr
7
1.03
0.08
26
BICKI Roman
6
0.88
0.07
Σ
675
100.00
7.83
.
.
Voting Results by location of ward electoral commission.
.
.
.
.
.
.
.
.
.
.
.
.
.
.
.
.
.
No.
Name
No. of entitled
to vote
No. of ballot
papers issued
No. of votes
No. of votes: per list / valid [%]
total
valid
per List
1
City
5143
1838
1837
1724
167
9.69
2
Country
24631
7209
7187
6893
508
7.37
.
Voting Results by number of inhabitants of commune
.
1
to 5 000
6518
1868
1860
1776
92
5.18
2
from 5 001 to 10 000
15343
4843
4828
4605
393
8.53
3
from 10 001 to 20 000
7913
2336
2336
2236
190
8.50
4
from 20 001 to 50 000
0
0
0
0
0
0.00
5
from 50 001 to 100 000
0
0
0
0
0
0.00
6
from 100 001 to 200 000
0
0
0
0
0
0.00
7
from 200 001 to 500 000
0
0
0
0
0
0.00
8
over 500 000
0
0
0
0
0
0.00
Legal Acts
Documents
Electoral Bodies
Election Committees
Turnout
Results
Statistical Data
SENATE
PRESIDENT
Created by
Copyright [c] 2005
Mikrobit Sp. z o.o.
. All Rights Reserved.
top