.
.
Legal Acts
Documents
Electoral Bodies
Election Committees
Turnout
Results
Statistical Data
SENATE
PRESIDENT
Created by
.
.
Voting Results
.
.
.
Voting Results for Committee
.
.
.
.
.
.
.
.
.
.
.
.
.
.
.
.
.
.
.
.
Polska
/
Legnica
/
głogowski, pow.
...
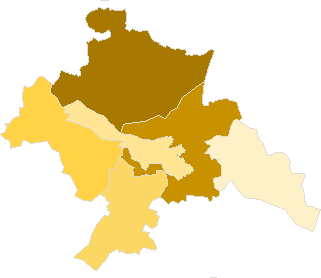
Komitet Wyborczy Liga Polskich Rodzin
List's Number:
3
No. of valid votes:
26419
No. of votes per List:
1588
6.01%
lack
4.00%
4.60%
5.20%
5.80%
6.40%
7.00%
7.60%
8.20%
8.80%
9.40%
not
.
.
.
.
.
.
.
.
.
.
.
.
of data
4.59%
5.19%
5.79%
6.39%
6.99%
7.59%
8.19%
8.79%
9.39%
10.00%
applicable
See also:
Turnout
Votes per Lists
Votes per Candidates
Information about Election Committee
Election results
Voting Results by location of ward electoral commission
.
.
Voting Results for Committee.
.
.
.
.
.
.
.
.
.
.
.
.
.
.
.
.
.
No.
Name
No. of entitled
to vote
No. of ballot papers
issued
No. of votes
No. of votes: per list / valid [%]
total
valid
per List
020302
Głogów, gm.
4134
1437
1436
1355
123
9.08
020301
Głogów, m.
57694
22965
22948
22061
1246
5.65
020303
Jerzmanowa, gm.
2343
818
818
771
50
6.49
020304
Kotla, gm.
3123
1007
1007
942
94
9.98
020305
Pęcław, gm.
1765
596
596
549
22
4.01
020306
Żukowice, gm.
2712
777
777
741
53
7.15
głogowski, pow.
71771
27600
27582
26419
1588
6.01
.
.
Voting Results for Candidates
.
.
.
.
.
.
.
.
.
.
.
.
.
.
.
No.
Surname Names
No. of votes
% No. of votes per candidate/No. per list
% No. of votes per candidate/No. of valid votes
1
ŚLUSARCZYK Piotr Jan
430
27.07
1.63
2
KUBIŃSKI Marcin Piotr
562
35.39
2.13
3
SZWIEC Bartłomiej Jan
50
3.14
0.19
4
ROLA Tomasz Jacek
13
0.81
0.05
5
TELEGA Mirosław
36
2.26
0.14
6
SKOROBOGATY Krzysztof
21
1.32
0.08
7
ZIMIRSKI Wojciech Dominik
16
1.00
0.06
8
BRZOZOWSKI Robert Mariusz
19
1.19
0.07
9
WOŹNY Zbigniew Piotr
34
2.14
0.13
10
LISIEWICZ Ryszard Mieczysław
34
2.14
0.13
11
KOSTROWICKI Krystyn
5
0.31
0.02
12
WIERZBICKI Adam Wiesław
57
3.58
0.22
13
NOWACZYK Mariusz Zygmunt
25
1.57
0.09
14
OLIWA Kazimierz
29
1.82
0.11
15
TARNOWSKI Jarosław Michał
14
0.88
0.05
16
KOŁODZIEJ Marcin Tomasz
24
1.51
0.09
17
KOPEĆ Kamil Szymon
39
2.45
0.15
18
ZABŁOCKA Anna Monika
78
4.91
0.30
19
MARKIEWICZ Natalia Barbara
25
1.57
0.09
20
JACEWICZ Monika Magdalena
19
1.19
0.07
21
SULOWSKA Barbara Grażyna
20
1.25
0.08
22
TRYBULSKA Teresa
21
1.32
0.08
23
ARDELLI Tomasz Krzysztof
3
0.18
0.01
24
BLICHARSKI Jacek
14
0.88
0.05
Σ
1588
100.00
6.01
.
.
Voting Results by location of ward electoral commission.
.
.
.
.
.
.
.
.
.
.
.
.
.
.
.
.
.
No.
Name
No. of entitled
to vote
No. of ballot
papers issued
No. of votes
No. of votes: per list / valid [%]
total
valid
per List
1
City
57694
22965
22948
22061
1246
5.65
2
Country
14077
4635
4634
4358
342
7.85
.
Voting Results by number of inhabitants of commune
.
1
to 5 000
9943
3198
3198
3003
219
7.29
2
from 5 001 to 10 000
4134
1437
1436
1355
123
9.08
3
from 10 001 to 20 000
0
0
0
0
0
0.00
4
from 20 001 to 50 000
0
0
0
0
0
0.00
5
from 50 001 to 100 000
57694
22965
22948
22061
1246
5.65
6
from 100 001 to 200 000
0
0
0
0
0
0.00
7
from 200 001 to 500 000
0
0
0
0
0
0.00
8
over 500 000
0
0
0
0
0
0.00
Legal Acts
Documents
Electoral Bodies
Election Committees
Turnout
Results
Statistical Data
SENATE
PRESIDENT
Created by
Copyright [c] 2005
Mikrobit Sp. z o.o.
. All Rights Reserved.
top