| . |
. |
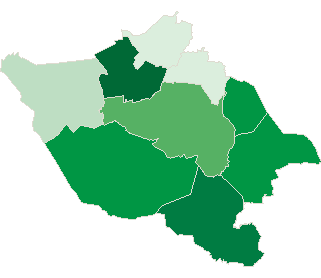
Number of People who has voted until 16:30 |
. |
. |
| . |
. |
| . |
. |
. |
. |
. |
. |
. |
. |
. |
. |
. |
. |
. |
. |
. |
. |
| Polska / Rybnik / wodzisławski, pow. |
 |
| wodzisławski, pow. |
| Statistics on 30.06.2005 |
| Population: |
155782 |
| Area: |
286.92 km2 |
| Population density: |
542 os/km2 |
| Election Statistic |
| No. of polling wards: |
93 |
No. of polling wards which
transmitted the results: |
93 |
| No. of people entitled to vote: |
123642 |
| No. of ballot papers issued: |
36985 |
29.91% |
|
| lack | 25.76% | 26.61% | 27.46% | 28.31% | 29.16% | 30.01% | 30.86% | 31.71% | 32.56% | 33.41% | | | . | . | . | . | . | . | . | . | . | . | . | . | | of data | 26.60% | 27.45% | 28.30% | 29.15% | 30.00% | 30.85% | 31.70% | 32.55% | 33.40% | 34.26% | |
|
See also:
|
| . |
. |
Number of people entitled to vote, number of ballot papers issued |
. |
. |
| . |
. |
| . |
. |
. |
. |
. |
. |
. |
. |
. |
. |
. |
. |
| No. |
Name |
No. of polling |
No. of people
entitled to vote |
No. of
ballot papers
issued |
No. of ballot papers issued / No. of people entitled to vote [%] |
| wards |
wards which
transmitted the results |
| 241505 | Godów, gm. | 8 | 8 | 9823 | 3252 | 33.11 |  |
| 241506 | Gorzyce, gm. | 14 | 14 | 15317 | 4899 | 31.98 | |
| 241507 | Lubomia, gm. | 8 | 8 | 6385 | 1718 | 26.91 | |
| 241508 | Marklowice, gm. | 3 | 3 | 4062 | 1317 | 32.42 | |
| 241509 | Mszana, gm. | 4 | 4 | 5403 | 1739 | 32.19 | |
| 241501 | Pszów, m. | 5 | 5 | 11290 | 3858 | 34.17 | |
| 241502 | Radlin, m. | 8 | 8 | 14117 | 3697 | 26.19 | |
| 241503 | Rydułtowy, m. | 14 | 14 | 17745 | 4571 | 25.76 | |
| 241504 | Wodzisław Śląski, m. | 29 | 29 | 39500 | 11934 | 30.21 | |
| |
wodzisławski, pow. |
93 |
93 |
123642 |
36985 |
29.91 |
 |
|
| |
| . |
. |
Turnout by location of ward electoral commission |
. |
. |
| . |
. |
| . |
. |
. |
. |
. |
. |
. |
. |
. |
. |
. |
. |
| No. |
Name |
No. of polling |
No. of people
entitled to vote |
No. of
ballot papers
issued |
No. of ballot papers issued / No. of people entitled to vote [%] |
| wards |
wards which
transmitted the results |
| 1 | rural commune | 37 | 37 | 40990 | 12925 | 31.53 | |
| 2 | urban commune | 56 | 56 | 82652 | 24060 | 29.11 | |
|
|


 Legal Acts

 Legal Acts