| . |
. |
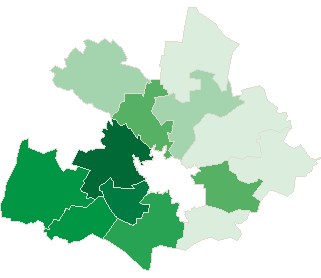
Number of People who has voted until 16:30 |
. |
. |
| . |
. |
| . |
. |
. |
. |
. |
. |
. |
. |
. |
. |
. |
. |
. |
. |
. |
. |
| Polska / Opole / opolski, pow. |
 |
| opolski, pow. |
| Statistics on 30.06.2005 |
| Population: |
132039 |
| Area: |
1586.82 km2 |
| Population density: |
83 os/km2 |
| Election Statistic |
| No. of polling wards: |
97 |
No. of polling wards which
transmitted the results: |
97 |
| No. of people entitled to vote: |
106420 |
| No. of ballot papers issued: |
21267 |
19.98% |
|
| lack | 17.26% | 17.91% | 18.56% | 19.21% | 19.86% | 20.51% | 21.16% | 21.81% | 22.46% | 23.11% | | | . | . | . | . | . | . | . | . | . | . | . | . | | of data | 17.90% | 18.55% | 19.20% | 19.85% | 20.50% | 21.15% | 21.80% | 22.45% | 23.10% | 23.76% | |
|
See also:
|
| . |
. |
Number of people entitled to vote, number of ballot papers issued |
. |
. |
| . |
. |
| . |
. |
. |
. |
. |
. |
. |
. |
. |
. |
. |
. |
| No. |
Name |
No. of polling |
No. of people
entitled to vote |
No. of
ballot papers
issued |
No. of ballot papers issued / No. of people entitled to vote [%] |
| wards |
wards which
transmitted the results |
| 160901 | Chrząstowice, gm. | 5 | 5 | 5207 | 1072 | 20.59 |  |
| 160902 | Dąbrowa, gm. | 7 | 7 | 7293 | 1727 | 23.68 | |
| 160903 | Dobrzeń Wielki, gm. | 11 | 11 | 11068 | 2285 | 20.65 | |
| 160904 | Komprachcice, gm. | 6 | 6 | 8651 | 1954 | 22.59 | |
| 160905 | Łubniany, gm. | 4 | 4 | 7396 | 1402 | 18.96 | |
| 160906 | Murów, gm. | 5 | 5 | 4722 | 824 | 17.45 | |
| 160907 | Niemodlin, gm. | 11 | 11 | 10722 | 2401 | 22.39 | |
| 160908 | Ozimek, gm. | 15 | 15 | 17087 | 2984 | 17.46 | |
| 160909 | Popielów, gm. | 5 | 5 | 6784 | 1278 | 18.84 | |
| 160910 | Prószków, gm. | 8 | 8 | 7756 | 1684 | 21.71 | |
| 160911 | Tarnów Opolski, gm. | 8 | 8 | 7782 | 1343 | 17.26 | |
| 160912 | Tułowice, gm. | 4 | 4 | 4259 | 945 | 22.19 | |
| 160913 | Turawa, gm. | 8 | 8 | 7693 | 1368 | 17.78 | |
| |
opolski, pow. |
97 |
97 |
106420 |
21267 |
19.98 |
 |
|
| |
| . |
. |
Turnout by location of ward electoral commission |
. |
. |
| . |
. |
| . |
. |
. |
. |
. |
. |
. |
. |
. |
. |
. |
. |
| No. |
Name |
No. of polling |
No. of people
entitled to vote |
No. of
ballot papers
issued |
No. of ballot papers issued / No. of people entitled to vote [%] |
| wards |
wards which
transmitted the results |
| 1 | rural commune | 63 | 63 | 70855 | 14198 | 20.04 | |
| 2 | urban - rural commune | 34 | 34 | 35565 | 7069 | 19.88 | |
|
|


 Legal Acts

 Legal Acts