| . |
. |
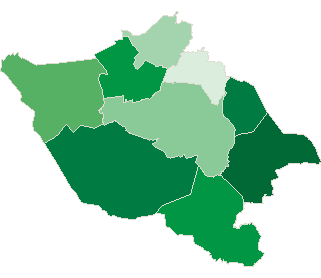
Number of People who has voted until 10:30 |
. |
. |
| . |
. |
| . |
. |
. |
. |
. |
. |
. |
. |
. |
. |
. |
. |
. |
. |
. |
. |
| Polska / Rybnik / wodzisławski, pow. |
 |
| wodzisławski, pow. |
| Statistics on 30.06.2005 |
| Population: |
155782 |
| Area: |
286.92 km2 |
| Population density: |
542 os/km2 |
| Election Statistic |
| No. of polling wards: |
93 |
No. of polling wards which
transmitted the results: |
93 |
| No. of people entitled to vote: |
122539 |
| No. of ballot papers issued: |
11197 |
9.14% |
|
| lack | 5.87% | 6.57% | 7.27% | 7.97% | 8.67% | 9.37% | 10.07% | 10.77% | 11.47% | 12.17% | | | . | . | . | . | . | . | . | . | . | . | . | . | | of data | 6.56% | 7.26% | 7.96% | 8.66% | 9.36% | 10.06% | 10.76% | 11.46% | 12.16% | 12.87% | |
|
See also:
|
| . |
. |
Number of people entitled to vote, number of ballot papers issued |
. |
. |
| . |
. |
| . |
. |
. |
. |
. |
. |
. |
. |
. |
. |
. |
. |
| No. |
Name |
No. of polling |
No. of people
entitled to vote |
No. of
ballot papers
issued |
No. of ballot papers issued / No. of people entitled to vote [%] |
| wards |
wards which
transmitted the results |
| 241505 | Godów, gm. | 8 | 8 | 9821 | 1111 | 11.31 |  |
| 241506 | Gorzyce, gm. | 14 | 14 | 15308 | 1764 | 11.52 | |
| 241507 | Lubomia, gm. | 8 | 8 | 6377 | 622 | 9.75 | |
| 241508 | Marklowice, gm. | 3 | 3 | 4062 | 482 | 11.87 | |
| 241509 | Mszana, gm. | 4 | 4 | 5405 | 690 | 12.77 | |
| 241501 | Pszów, m. | 5 | 5 | 10293 | 1127 | 10.95 | |
| 241502 | Radlin, m. | 8 | 8 | 14100 | 828 | 5.87 | |
| 241503 | Rydułtowy, m. | 14 | 14 | 17706 | 1396 | 7.88 | |
| 241504 | Wodzisław Śląski, m. | 29 | 29 | 39467 | 3177 | 8.05 | |
| |
wodzisławski, pow. |
93 |
93 |
122539 |
11197 |
9.14 |
 |
|
| |
| . |
. |
Turnout by location of ward electoral commission |
. |
. |
| . |
. |
| . |
. |
. |
. |
. |
. |
. |
. |
. |
. |
. |
. |
| No. |
Name |
No. of polling |
No. of people
entitled to vote |
No. of
ballot papers
issued |
No. of ballot papers issued / No. of people entitled to vote [%] |
| wards |
wards which
transmitted the results |
| 1 | rural commune | 37 | 37 | 40973 | 4669 | 11.40 | |
| 2 | urban commune | 56 | 56 | 81566 | 6528 | 8.00 | |
|
|


 Legal Acts

 Legal Acts