| . |
. |
Turnout in Election to the Sejm |
. |
. |
| . |
. |
| . |
. |
. |
. |
. |
. |
. |
. |
. |
. |
. |
. |
. |
. |
. |
. |
| Polska / Szczecin / gryfiński, pow. ... |
 |
| gryfiński, pow. |
| Statistics on 30.06.2005 |
| Population: |
84362 |
| Area: |
1869.54 km2 |
| Population density: |
45 os/km2 |
| Summary voting results |
| No. of polling wards: |
53 |
No. of polling wards which
transmitted the results: |
53 |
| No. of people entitled to vote: |
65059 |
| No. of ballot papers issued: |
21088 |
32.41% |
|
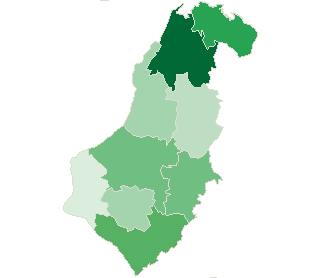
| lack | 20.41% | 22.35% | 24.29% | 26.23% | 28.17% | 30.11% | 32.05% | 33.99% | 35.93% | 37.87% | | | . | . | . | . | . | . | . | . | . | . | . | . | | of data | 22.34% | 24.28% | 26.22% | 28.16% | 30.10% | 32.04% | 33.98% | 35.92% | 37.86% | 39.81% | |
|
See also:
|
| . |
. |
Voting results |
. |
. |
| . |
. |
| . |
. |
. |
. |
. |
. |
. |
. |
. |
. |
. |
. |
| No. |
Name |
No. entitled
to vote |
No. of ballot
papers issued |
No. of |
No. of ballot papers issued / No. entitled to vote
[%] |
| total votes |
valid votes |
| 320601 | Banie, gm. | 5078 | 1229 | 1227 | 1141 | 24.20 |  |
| 320602 | Cedynia, gm. | 3468 | 708 | 708 | 669 | 20.42 |  |
| 320603 | Chojna, gm. | 10688 | 3201 | 3200 | 3048 | 29.95 |  |
| 320604 | Gryfino, gm. | 24856 | 9881 | 9834 | 9465 | 39.75 |  |
| 320605 | Mieszkowice, gm. | 5782 | 1811 | 1810 | 1752 | 31.32 |  |
| 320606 | Moryń, gm. | 3452 | 894 | 894 | 831 | 25.90 |  |
| 320607 | Stare Czarnowo, gm. | 2967 | 967 | 967 | 924 | 32.59 |  |
| 320608 | Trzcińsko-Zdrój, gm. | 4518 | 1346 | 1346 | 1305 | 29.79 |  |
| 320609 | Widuchowa, gm. | 4250 | 1051 | 1051 | 986 | 24.73 |  |
| |
gryfiński, pow. |
65059 |
21088 |
21037 |
20121 |
32.41 |
 |
|
| |
| . |
. |
Turnout by location of ward electoral commission |
. |
. |
| . |
. |
| . |
. |
. |
. |
. |
. |
. |
. |
. |
. |
. |
. |
| No. |
Name |
No. entitled
to vote |
No. of ballot
papers issued |
No. of |
No. of ballot papers issued / No. entitled to vote
[%] |
| total votes |
valid votes |
| 1 | City | 34887 | 12975 | 12931 | 12459 | 37.19 |  |
| 2 | Country | 30172 | 8113 | 8106 | 7662 | 26.89 |  |
| . |
Turnout by number of inhabitants of commune |
. |
| 1 | to 5 000 | 9887 | 2569 | 2569 | 2424 | 25.98 |  |
| 2 | from 5 001 to 10 000 | 19628 | 5437 | 5434 | 5184 | 27.70 |  |
| 3 | from 10 001 to 20 000 | 10688 | 3201 | 3200 | 3048 | 29.95 |  |
| 4 | from 20 001 to 50 000 | 24856 | 9881 | 9834 | 9465 | 39.75 |  |
| 5 | from 50 001 to 100 000 | 0 | 0 | 0 | 0 | 0.00 | |
| 6 | from 100 001 to 200 000 | 0 | 0 | 0 | 0 | 0.00 | |
| 7 | from 200 001 to 500 000 | 0 | 0 | 0 | 0 | 0.00 | |
| 8 | over 500 000 | 0 | 0 | 0 | 0 | 0.00 | |
|
|


 Legal Acts
 Documents
 Electoral Bodies
 Election Committees
 Turnout
 Results
 Statistical Data
 SENATE
 PRESIDENT
 Created by


 Legal Acts
 Documents
 Electoral Bodies
 Election Committees
 Turnout
 Results
 Statistical Data
 SENATE
 PRESIDENT
 Created by


