| . |
. |
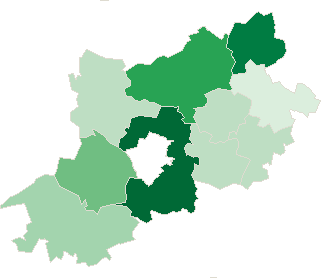
Turnout in Election to the Sejm |
. |
. |
| . |
. |
| . |
. |
. |
. |
. |
. |
. |
. |
. |
. |
. |
. |
. |
. |
. |
. |
| Polska / Zielona Góra / zielonogórski, pow. ... |
 |
| zielonogórski, pow. |
| Statistics on 30.06.2005 |
| Population: |
88305 |
| Area: |
1570.64 km2 |
| Population density: |
56 os/km2 |
| Summary voting results |
| No. of polling wards: |
58 |
No. of polling wards which
transmitted the results: |
58 |
| No. of people entitled to vote: |
68598 |
| No. of ballot papers issued: |
23280 |
33.94% |
|
| lack | 28.77% | 29.78% | 30.79% | 31.80% | 32.81% | 33.82% | 34.83% | 35.84% | 36.85% | 37.86% | | | . | . | . | . | . | . | . | . | . | . | . | . | | of data | 29.77% | 30.78% | 31.79% | 32.80% | 33.81% | 34.82% | 35.83% | 36.84% | 37.85% | 38.87% | |
|
See also:
|
| . |
. |
Voting results |
. |
. |
| . |
. |
| . |
. |
. |
. |
. |
. |
. |
. |
. |
. |
. |
. |
| No. |
Name |
No. entitled
to vote |
No. of ballot
papers issued |
No. of |
No. of ballot papers issued / No. entitled to vote
[%] |
| total votes |
valid votes |
| 080901 | Babimost, gm. | 4878 | 1802 | 1802 | 1701 | 36.94 |  |
| 080902 | Bojadła, gm. | 2582 | 788 | 763 | 709 | 30.52 | |
| 080903 | Czerwieńsk, gm. | 7319 | 2235 | 2210 | 2114 | 30.54 | |
| 080904 | Kargowa, gm. | 4424 | 1273 | 1273 | 1212 | 28.77 | |
| 080905 | Nowogród Bobrzański, gm. | 7679 | 2402 | 2402 | 2250 | 31.28 | |
| 080906 | Sulechów, gm. | 20501 | 7227 | 7224 | 6877 | 35.25 | |
| 080907 | Świdnica, gm. | 4212 | 1386 | 1386 | 1321 | 32.91 | |
| 080908 | Trzebiechów, gm. | 2523 | 775 | 775 | 690 | 30.72 | |
| 080909 | Zabór, gm. | 2573 | 772 | 771 | 731 | 30.00 | |
| 080910 | Zielona Góra, gm. | 11907 | 4620 | 4616 | 4489 | 38.80 | |
| |
zielonogórski, pow. |
68598 |
23280 |
23222 |
22094 |
33.94 |
 |
|
| |
| . |
. |
Turnout by location of ward electoral commission |
. |
. |
| . |
. |
| . |
. |
. |
. |
. |
. |
. |
. |
. |
. |
. |
. |
| No. |
Name |
No. entitled
to vote |
No. of ballot
papers issued |
No. of |
No. of ballot papers issued / No. entitled to vote
[%] |
| total votes |
valid votes |
| 1 | City | 28774 | 10222 | 10197 | 9731 | 35.53 | |
| 2 | Country | 39824 | 13058 | 13025 | 12363 | 32.79 | |
| . |
Turnout by number of inhabitants of commune |
. |
| 1 | to 5 000 | 7678 | 2335 | 2309 | 2130 | 30.41 | |
| 2 | from 5 001 to 10 000 | 28512 | 9098 | 9073 | 8598 | 31.91 | |
| 3 | from 10 001 to 20 000 | 11907 | 4620 | 4616 | 4489 | 38.80 | |
| 4 | from 20 001 to 50 000 | 20501 | 7227 | 7224 | 6877 | 35.25 | |
| 5 | from 50 001 to 100 000 | 0 | 0 | 0 | 0 | 0.00 | |
| 6 | from 100 001 to 200 000 | 0 | 0 | 0 | 0 | 0.00 | |
| 7 | from 200 001 to 500 000 | 0 | 0 | 0 | 0 | 0.00 | |
| 8 | over 500 000 | 0 | 0 | 0 | 0 | 0.00 | |
|
|


 Legal Acts

 Legal Acts