| . |
. |
Electoral Constituencies |
. |
. |
| . |
. |
| . |
. |
. |
. |
. |
. |
. |
. |
. |
. |
. |
. |
. |
. |
. |
. |
| Polska / Elbląg |
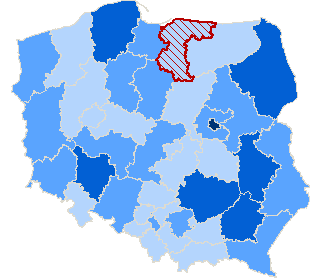 |
| Elbląg, okr. 34 |
| Statistical Data |
| Number of lists: |
13 |
| Number of candidates: |
171 |
| female: |
31 (18.13%) |
| male: |
140 (81.87%) |
| Number of seats: |
8 |
| Number of candidates/seat: |
21 |
| The average age of: |
43 |
| female: |
41 |
| male: |
43 |
| Youngest: |
21 |
| Oldest: |
68 |
|
| 7 |
11 |
14 |
17 |
| . |
. |
. |
. |
| 10 |
13 |
16 |
19 |
|
| . |
. |
The number of candidates in the age brackets |
. |
. |
| . |
. |
| . |
. |
. |
. |
. |
. |
. |
. |
. |
. |
. |
| age brackets |
Number of candidates |
total % |
female |
male |
| Number |
% |
Number |
% |
| 21 - 29 |
36 |
21.05 |
7 |
4.09 |
29 |
16.96 |
| 30 - 39 |
24 |
14.04 |
7 |
4.09 |
17 |
9.94 |
| 40 - 49 |
48 |
28.07 |
8 |
4.68 |
40 |
23.39 |
| 50 - 59 |
57 |
33.33 |
8 |
4.68 |
49 |
28.65 |
| 60 - 69 |
6 |
3.51 |
1 |
0.58 |
5 |
2.92 |
| 70 and over |
0 |
0.00 |
0 |
0.00 |
0 |
0.00 |
| total |
171 |
100.00 |
31 |
18.13 |
140 |
81.87 |
|
|


 Legal Acts
 Constituencies Electoral