| . |
. |
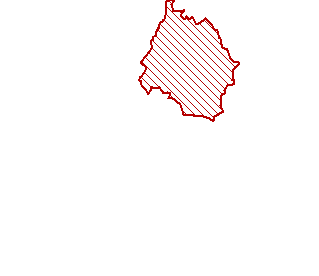
Turnout in Presidential Election |
. |
. |
| . |
. |
| . |
. |
. |
. |
. |
. |
. |
. |
. |
. |
. |
. |
. |
. |
. |
. |
| Polska / warmińsko-mazurskie, woj. / iławski, pow. / Zalewo, gm. |
 |
| Zalewo, gm. |
| Statistics on 30.06.2005 |
| Population: |
7574 |
| Area: |
254.34 km2 |
| Population density: |
29 os/km2 |
| Summary voting results |
| Number of people entitled to vote: |
5675 |
| Number of ballot papers issued: |
1787 |
| Total votes: |
1787 |
| Number of valid votes: |
1772 |
31.49% |
|
| lack | 31.48% | 33.78% | 36.08% | 38.38% | 40.68% | 42.98% | 45.28% | 47.58% | 49.88% | 52.18% | | | . | . | . | . | . | . | . | . | . | . | . | . | | of data | 33.77% | 36.07% | 38.37% | 40.67% | 42.97% | 45.27% | 47.57% | 49.87% | 52.17% | 54.48% | |
|
See also:
|
|
| |
|
|


 Legal Acts
 Documents
 Electoral Bodies
 Candidates
 Turnout
 Results
 Repeat ballot
 SEJM
SEJM SENATE
 Created by
 Legal Acts
 Documents
 Electoral Bodies
 Candidates
 Turnout
 Results
 Repeat ballot
 SEJM
SEJM SENATE
 Created by


