| . |
. |
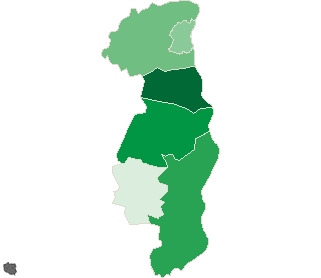
Number of people who has voted until 10:30 |
. |
. |
| . |
. |
| . |
. |
. |
. |
. |
. |
. |
. |
. |
. |
. |
. |
. |
. |
. |
. |
| Polska / pomorskie, woj. / tczewski, pow. |
 |
| tczewski, pow. |
| Statistics on 30.06.2005 |
| Population: |
113061 |
| Area: |
697.54 km2 |
| Population density: |
162 os/km2 |
| Election Statistic |
| Number of polling wards: |
73 |
| Number of polling wards which transmitted the results: |
73 |
| Number of people entitled to vote: |
86305 |
| Number of ballot papers issued: |
6155 |
7.13% |
|
| lack | 4.41% | 4.97% | 5.53% | 6.09% | 6.65% | 7.21% | 7.77% | 8.33% | 8.89% | 9.45% | | | . | . | . | . | . | . | . | . | . | . | . | . | | of data | 4.96% | 5.52% | 6.08% | 6.64% | 7.20% | 7.76% | 8.32% | 8.88% | 9.44% | 10.01% | |
|
See also:
|
| . |
. |
Number of people entitled to vote, Number of ballot papers issued |
. |
. |
| . |
. |
| . |
. |
. |
. |
. |
. |
. |
. |
. |
. |
. |
. |
| No. |
Name |
No. of polling |
No. of people
entitled to vote |
No. of
ballot papers
issued |
No. of: ballot papers issued / entitled to vote [%] |
| wards |
wards which
transmitted the results |
| 221402 | Gniew, gm. | 11 | 11 | 12194 | 971 | 7.96 |  |
| 221403 | Morzeszczyn, gm. | 3 | 3 | 2765 | 122 | 4.41 |  |
| 221404 | Pelplin, gm. | 12 | 12 | 12558 | 1110 | 8.84 |  |
| 221405 | Subkowy, gm. | 3 | 3 | 3703 | 369 | 9.96 |  |
| 221406 | Tczew, gm. | 12 | 12 | 8192 | 554 | 6.76 |  |
| 221401 | Tczew, m. | 32 | 32 | 46893 | 3029 | 6.46 |  |
| |
tczewski, pow. |
73 |
73 |
86305 |
6155 |
7.13 |
 |
|
| |
| . |
. |
Turnout by location of ward electoral commission |
. |
. |
| . |
. |
| . |
. |
. |
. |
. |
. |
. |
. |
. |
. |
. |
. |
| No. |
Name |
No. of polling |
No. of people
entitled to vote |
No. of
ballot papers
issued |
No. of: ballot papers issued / entitled to vote [%] |
| wards |
wards which
transmitted the results |
| 1 | rural commune | 18 | 18 | 14660 | 1045 | 7.13 |  |
| 2 | urban - rural commune | 23 | 23 | 24752 | 2081 | 8.41 |  |
| 3 | urban commune | 32 | 32 | 46893 | 3029 | 6.46 |  |
|
|


 Legal Acts
 Documents
 Electoral Bodies
 Candidates
 Turnout
 Results
 Repeat ballot
 SEJM
SEJM SENATE
 Created by

 Legal Acts
 Documents
 Electoral Bodies
 Candidates
 Turnout
 Results
 Repeat ballot
 SEJM
SEJM SENATE
 Created by


