| . |
. |
Number of people who has voted until 10:30 |
. |
. |
| . |
. |
| . |
. |
. |
. |
. |
. |
. |
. |
. |
. |
. |
. |
. |
. |
. |
. |
| Polska / małopolskie, woj. / gorlicki, pow. |
 |
| gorlicki, pow. |
| Statistics on 30.06.2005 |
| Population: |
110125 |
| Area: |
967.36 km2 |
| Population density: |
113 os/km2 |
| Election Statistic |
| Number of polling wards: |
89 |
| Number of polling wards which transmitted the results: |
89 |
| Number of people entitled to vote: |
83298 |
| Number of ballot papers issued: |
12439 |
14.93% |
|
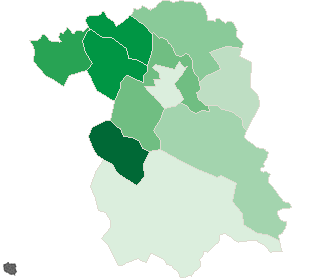
| lack | 11.39% | 12.49% | 13.59% | 14.69% | 15.79% | 16.89% | 17.99% | 19.09% | 20.19% | 21.29% | | | . | . | . | . | . | . | . | . | . | . | . | . | | of data | 12.48% | 13.58% | 14.68% | 15.78% | 16.88% | 17.98% | 19.08% | 20.18% | 21.28% | 22.39% | |
|
See also:
|
| . |
. |
Number of people entitled to vote, Number of ballot papers issued |
. |
. |
| . |
. |
| . |
. |
. |
. |
. |
. |
. |
. |
. |
. |
. |
. |
| No. |
Name |
No. of polling |
No. of people
entitled to vote |
No. of
ballot papers
issued |
No. of: ballot papers issued / entitled to vote [%] |
| wards |
wards which
transmitted the results |
| 120502 | Biecz, gm. | 13 | 13 | 13175 | 1975 | 14.99 |  |
| 120503 | Bobowa, gm. | 7 | 7 | 6631 | 1216 | 18.34 | |
| 120504 | Gorlice, gm. | 11 | 11 | 12336 | 1977 | 16.03 | |
| 120501 | Gorlice, m. | 22 | 22 | 24198 | 2857 | 11.81 | |
| 120505 | Lipinki, gm. | 7 | 7 | 5241 | 656 | 12.52 | |
| 120506 | Łużna, gm. | 6 | 6 | 6152 | 1201 | 19.52 | |
| 120507 | Moszczenica, gm. | 3 | 3 | 3621 | 706 | 19.50 | |
| 120508 | Ropa, gm. | 4 | 4 | 3616 | 806 | 22.29 | |
| 120509 | Sękowa, gm. | 6 | 6 | 3649 | 512 | 14.03 | |
| 120510 | Uście Gorlickie, gm. | 10 | 10 | 4679 | 533 | 11.39 | |
| |
gorlicki, pow. |
89 |
89 |
83298 |
12439 |
14.93 |
 |
|
| |
| . |
. |
Turnout by location of ward electoral commission |
. |
. |
| . |
. |
| . |
. |
. |
. |
. |
. |
. |
. |
. |
. |
. |
. |
| No. |
Name |
No. of polling |
No. of people
entitled to vote |
No. of
ballot papers
issued |
No. of: ballot papers issued / entitled to vote [%] |
| wards |
wards which
transmitted the results |
| 1 | rural commune | 54 | 54 | 45925 | 7607 | 16.56 | |
| 2 | urban - rural commune | 13 | 13 | 13175 | 1975 | 14.99 | |
| 3 | urban commune | 22 | 22 | 24198 | 2857 | 11.81 | |
|
|


 Legal Acts

 Legal Acts