| . |
. |
Turnout in Presidential Election |
. |
. |
| . |
. |
| . |
. |
. |
. |
. |
. |
. |
. |
. |
. |
. |
. |
. |
. |
. |
. |
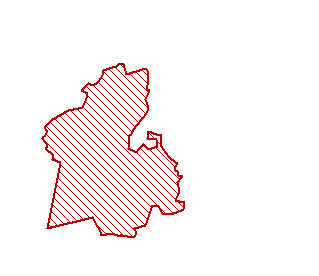
| Polska / zachodniopomorskie, woj. / kamieński, pow. / Wolin, gm. |
 |
| Wolin, gm. |
| Statistics on 30.06.2005 |
| Population: |
12585 |
| Area: |
327.41 km2 |
| Population density: |
38 os/km2 |
| Summary voting results |
| Number of polling wards: |
11 |
| Number of polling wards which transmitted the results: |
11 |
| Number of people entitled to vote: |
9861 |
| Number of ballot papers issued: |
3701 |
37.53% |
|
| lack | 34.22% | 35.70% | 37.18% | 38.66% | 40.14% | 41.62% | 43.10% | 44.58% | 46.06% | 47.54% | | | . | . | . | . | . | . | . | . | . | . | . | . | | of data | 35.69% | 37.17% | 38.65% | 40.13% | 41.61% | 43.09% | 44.57% | 46.05% | 47.53% | 49.02% | |
|
See also:
|
|
|
| |
|


 Legal Acts
 Documents
 Electoral Bodies
 Candidates
 Turnout
 Results
 Repeat ballot
 SEJM
SEJM SENATE
 Created by


 Legal Acts
 Documents
 Electoral Bodies
 Candidates
 Turnout
 Results
 Repeat ballot
 SEJM
SEJM SENATE
 Created by


