|
See also:
|
| . |
. |
Number of people entitled to vote, Number of ballot papers issued |
. |
. |
| . |
. |
| . |
. |
. |
. |
. |
. |
. |
. |
. |
. |
. |
. |
| No. |
Name |
No. of polling |
No. of people
entitled to vote |
No. of
ballot papers
issued |
No. of: ballot papers issued / entitled to vote [%] |
| wards |
wards which
transmitted the results |
| 241603 | Irządze, gm. | 3 | 3 | 2324 | 570 | 24.53 |  |
| 241604 | Kroczyce, gm. | 5 | 5 | 4827 | 1442 | 29.87 | |
| 241605 | Łazy, gm. | 10 | 10 | 13311 | 3789 | 28.47 | |
| 241606 | Ogrodzieniec, gm. | 6 | 6 | 7896 | 2618 | 33.16 | |
| 241607 | Pilica, gm. | 7 | 7 | 7557 | 2376 | 31.44 | |
| 241601 | Poręba, m. | 5 | 5 | 7356 | 1943 | 26.41 | |
| 241608 | Szczekociny, gm. | 9 | 9 | 6916 | 2021 | 29.22 | |
| 241609 | Włodowice, gm. | 4 | 4 | 4231 | 1236 | 29.21 | |
| 241602 | Zawiercie, m. | 34 | 34 | 44733 | 13927 | 31.13 | |
| 241610 | Żarnowiec, gm. | 7 | 7 | 3952 | 1429 | 36.16 | |
| |
zawierciański, pow. |
90 |
90 |
103103 |
31351 |
30.41 |
 |
|
| |
| . |
. |
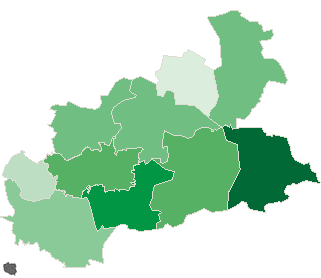
Turnout by location of ward electoral commission |
. |
. |
| . |
. |
| . |
. |
. |
. |
. |
. |
. |
. |
. |
. |
. |
. |
| No. |
Name |
No. of polling |
No. of people
entitled to vote |
No. of
ballot papers
issued |
No. of: ballot papers issued / entitled to vote [%] |
| wards |
wards which
transmitted the results |
| 1 | rural commune | 19 | 19 | 15334 | 4677 | 30.50 | |
| 2 | urban - rural commune | 32 | 32 | 35680 | 10804 | 30.28 | |
| 3 | urban commune | 39 | 39 | 52089 | 15870 | 30.47 | |
|
|


 Legal Acts

 Legal Acts