|
See also:
|
| . |
. |
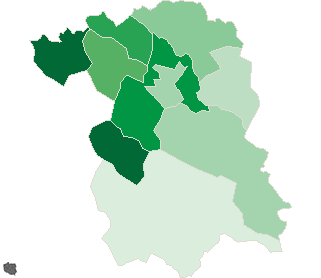
Number of people entitled to vote, Number of ballot papers issued |
. |
. |
| . |
. |
| . |
. |
. |
. |
. |
. |
. |
. |
. |
. |
. |
. |
| No. |
Name |
No. of polling |
No. of people
entitled to vote |
No. of
ballot papers
issued |
No. of: ballot papers issued / entitled to vote [%] |
| wards |
wards which
transmitted the results |
| 120502 | Biecz, gm. | 13 | 13 | 13117 | 5192 | 39.58 |  |
| 120503 | Bobowa, gm. | 7 | 7 | 6611 | 3106 | 46.98 | |
| 120504 | Gorlice, gm. | 11 | 11 | 12335 | 5502 | 44.60 | |
| 120501 | Gorlice, m. | 22 | 22 | 24450 | 9569 | 39.14 | |
| 120505 | Lipinki, gm. | 7 | 7 | 5217 | 1965 | 37.67 | |
| 120506 | Łużna, gm. | 6 | 6 | 6122 | 2577 | 42.09 | |
| 120507 | Moszczenica, gm. | 3 | 3 | 3580 | 1554 | 43.41 | |
| 120508 | Ropa, gm. | 4 | 4 | 3584 | 1728 | 48.21 | |
| 120509 | Sękowa, gm. | 6 | 6 | 3628 | 1401 | 38.62 | |
| 120510 | Uście Gorlickie, gm. | 10 | 10 | 4704 | 1676 | 35.63 | |
| |
gorlicki, pow. |
89 |
89 |
83348 |
34270 |
41.12 |
 |
|
| |
| . |
. |
Turnout by location of ward electoral commission |
. |
. |
| . |
. |
| . |
. |
. |
. |
. |
. |
. |
. |
. |
. |
. |
. |
| No. |
Name |
No. of polling |
No. of people
entitled to vote |
No. of
ballot papers
issued |
No. of: ballot papers issued / entitled to vote [%] |
| wards |
wards which
transmitted the results |
| 1 | rural commune | 54 | 54 | 45781 | 19509 | 42.61 | |
| 2 | urban - rural commune | 13 | 13 | 13117 | 5192 | 39.58 | |
| 3 | urban commune | 22 | 22 | 24450 | 9569 | 39.14 | |
|
|


 Legal Acts

 Legal Acts